## Heatmap: Timing Analysis
### Overview
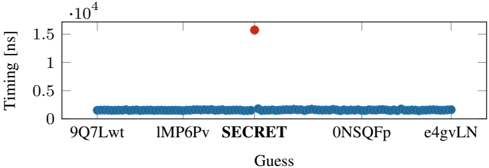
The heatmap displays the timing measurements for various guesses, represented by different colors. The x-axis lists the guesses, while the y-axis shows the timing in nanoseconds (ns).
### Components/Axes
- **X-axis**: Guesses labeled as "9Q7Lwt", "1MP6Pv", "SECRET", "0NSQFp", and "e4gvLN".
- **Y-axis**: Timing in nanoseconds (ns), ranging from 0 to 1.5 x 10^4 ns.
- **Color Scale**: The heatmap uses a color gradient from blue to red, indicating increasing timing values.
### Detailed Analysis or ### Content Details
- The guess "SECRET" has the highest timing value, approximately 1.5 x 10^4 ns, marked by a red dot.
- The other guesses have significantly lower timing values, ranging from 0 to 0.5 x 10^4 ns, represented by blue dots.
- The timing values for the other guesses are relatively close to each other, with "9Q7Lwt" and "1MP6Pv" having the lowest values.
### Key Observations
- The guess "SECRET" is the most time-consuming, indicating it may be the slowest or most complex.
- The other guesses have shorter timing values, suggesting they are faster or simpler.
- There is a noticeable difference in timing between the guesses, with "SECRET" being the outlier.
### Interpretation
The heatmap suggests that the guess "SECRET" is significantly slower than the others, which could imply that it is more complex or requires more computational resources. The other guesses are likely faster and simpler, which could be due to their design or implementation. The difference in timing could be due to various factors such as algorithm efficiency, hardware constraints, or the complexity of the guess itself.