# Stacked Bar Chart Analysis
## Chart Type
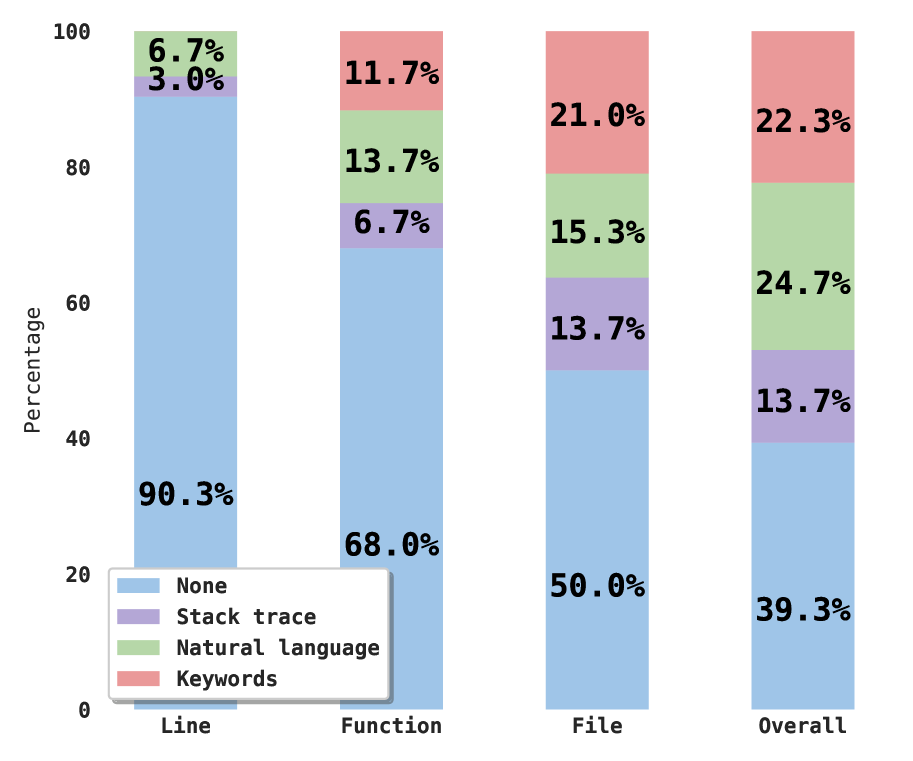
- Stacked bar chart
## Axis Labels
- **X-axis**: Categories (`Line`, `Function`, `File`, `Overall`)
- **Y-axis**: `Percentage` (0–100)
## Legend
- **Colors and Labels**:
- `Blue`: `None`
- `Purple`: `Stack trace`
- `Green`: `Natural language`
- `Red`: `Keywords`
## Data Points
### Line
- `None`: 90.3%
- `Stack trace`: 3.0%
- `Natural language`: 6.7%
- `Keywords`: 0%
### Function
- `None`: 68.0%
- `Stack trace`: 6.7%
- `Natural language`: 13.7%
- `Keywords`: 11.7%
### File
- `None`: 50.0%
- `Stack trace`: 13.7%
- `Natural language`: 15.3%
- `Keywords`: 21.0%
### Overall
- `None`: 39.3%
- `Stack trace`: 13.7%
- `Natural language`: 24.7%
- `Keywords`: 22.3%
## Key Trends
1. **Dominance of `None`**:
- Highest in `Line` (90.3%) and decreases progressively to `Overall` (39.3%).
2. **Growth of `Keywords`**:
- Increases from 0% in `Line` to 22.3% in `Overall`.
3. **`Natural language`**:
- Rises from 6.7% (`Line`) to 24.7% (`Overall`), becoming the second-largest segment in `Overall`.
4. **`Stack trace`**:
- Relatively stable (3.0–13.7%) across categories, peaking in `File` and `Overall`.
## Cross-Reference Validation
- Legend colors match bar segments:
- `Blue` (`None`) consistently occupies the largest portion of each bar.
- `Red` (`Keywords`) grows visibly from `Line` to `Overall`.
- `Green` (`Natural language`) and `Purple` (`Stack trace`) segments align with their labeled percentages.