## Flowchart: Mathematical Probability Problem Solving Process
### Overview
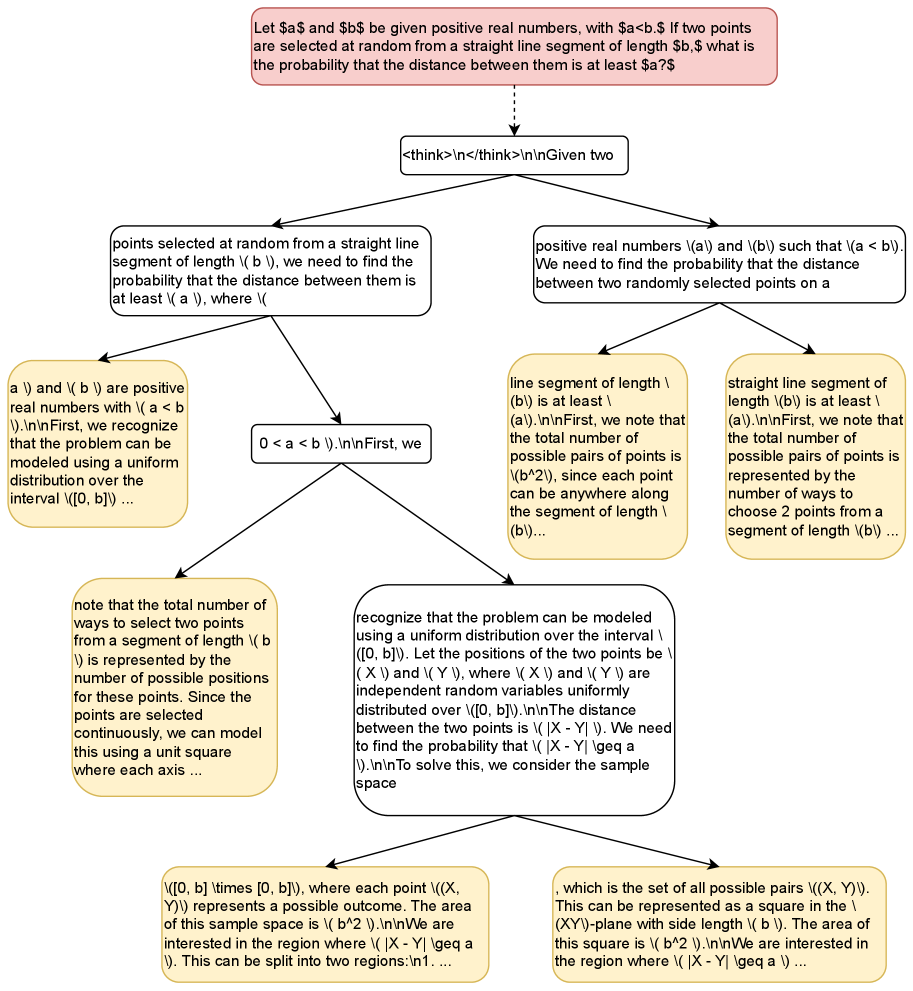
The image displays a hierarchical flowchart representing a step-by-step logical derivation for a probability problem. The diagram illustrates an AI-style "Chain of Thought" process, where a mathematical problem is broken down into multiple, sometimes redundant, reasoning paths. The flow moves from the top problem statement down through various branches of logic, ultimately converging on a geometric probability approach.
### Components/Axes
* **Structure:** A top-down tree diagram with branching nodes.
* **Node Types:**
* **Top Node (Red/Pink):** The primary problem statement.
* **Intermediate Nodes (White):** Core logical steps and reasoning.
* **Supporting Nodes (Tan/Yellow):** Explanatory details and context.
* **Connectors:** Black arrows indicating the flow of logic.
### Detailed Analysis
The text contains raw LaTeX markup (e.g., `\n`, `\geq`, `\times`). The transcription below preserves the exact formatting found in the image.
**1. Top Node (Problem Statement)**
* "Let $a$ and $b$ be given positive real numbers, with $a<b$. If two points are selected at random from a straight line segment of length $b$, what is the probability that the distance between them is at least $a$?"
**2. First Branch (Initial Processing)**
* **Center Node:** `\n\nGiven two`
**3. Second Branch (Splitting)**
* **Left Path:** "points selected at random from a straight line segment of length \( b \), we need to find the probability that the distance between them is at least \( a \), where ("
* **Right Path:** "positive real numbers \(a\) and \(b\) such that \(a < b\). We need to find the probability that the distance between two randomly selected points on a"
**4. Third Branch (Further Decomposition)**
* **Leftmost Tan Box:** "a \( b \) are positive real numbers with \( a < b \).\n\nFirst, we recognize that the problem can be modeled using a uniform distribution over the interval \([0, b]\) ..."
* **Middle White Box:** "0 < a < b \).\n\nFirst, we"
* **Middle-Right Tan Box:** "line segment of length \( (b\) is at least \( (a\).\n\nFirst, we note that the total number of possible pairs of points is \( (b^2 \), since each point can be anywhere along the segment of length \( (b\)..."
* **Rightmost Tan Box:** "straight line segment of length \( (b\) is at least \( (a\).\n\nFirst, we note that the total number of possible pairs of points is represented by the number of ways to choose 2 points from a segment of length \( (b\) ..."
**5. Fourth Branch (Deepening Logic)**
* **Left Tan Box (from Middle White Box):** "note that the total number of ways to select two points from a segment of length \( (b \) is represented by the number of possible positions for these points. Since the points are selected continuously, we can model this using a unit square where each axis ..."
* **Center White Box:** "recognize that the problem can be modeled using a uniform distribution over the interval \( ([0, b]). Let the positions of the two points be \( (X \) and \( (Y \), where \( (X \) and \( (Y \) are independent random variables uniformly distributed over \( ([0, b]).\n\nThe distance between the two points is \( |X - Y| \geq a \).\n\nTo solve this, we consider the sample space"
**6. Fifth Branch (Final Conclusion/Setup)**
* **Bottom Left Tan Box:** "\( [0, b] \times [0, b] \), where each point \( ((X, Y) \) represents a possible outcome. The area of this sample space is \( (b^2 \).\n\nWe are interested in the region where \( |X - Y| \geq a \). This can be split into two regions:\n1. ..."
* **Bottom Right Tan Box:** ", which is the set of all possible pairs \( ((X, Y) \). This can be represented as a square in the \( (XY \)-plane with side length \( (b \). The area of this square is \( (b^2 \).\n\nWe are interested in the region where \( |X - Y| \geq a \) ..."
### Key Observations
* **Redundancy:** The diagram is highly repetitive. Multiple branches explore the same concepts (e.g., defining the sample space as a square of side $b$ and area $b^2$) using slightly different phrasing.
* **Formatting:** The text includes raw LaTeX syntax and newline characters (`\n`), indicating this is likely a raw output from an LLM (Large Language Model) or a similar automated reasoning system.
* **Logic Flow:** The diagram effectively demonstrates a "Chain of Thought" process where the system generates multiple potential paths to solve the problem, eventually converging on the standard geometric probability solution (using a square sample space and the condition $|X-Y| \geq a$).
### Interpretation
The data demonstrates a classic geometric probability problem. The problem asks for the probability that the distance between two points chosen uniformly at random on a line segment of length $b$ is at least $a$.
The reasoning process shown in the diagram correctly identifies the standard solution method:
1. **Model:** Treat the two points as independent random variables $X$ and $Y$ on the interval $[0, b]$.
2. **Sample Space:** The sample space is a square of area $b^2$ in the $XY$-plane.
3. **Condition:** The favorable region is defined by $|X - Y| \geq a$.
4. **Geometric Solution:** This region corresponds to the two triangles in the corners of the square (the area of the square minus the central strip where $|X - Y| < a$).
The diagram is an artifact of an AI reasoning process, showing the "exploration" phase where the model generates multiple, overlapping explanations for the same mathematical setup before settling on the final geometric formulation.