\n
## Diagram: Probability Problem Breakdown
### Overview
The image presents a diagram outlining the steps to solve a probability problem. The problem involves finding the probability that the distance between two points randomly selected on a line segment of length *b* is at least *a*, where 0 < *a* < *b*. The diagram breaks down the problem into smaller steps, using geometric reasoning and uniform distribution concepts. The diagram is structured as a flow chart with text blocks explaining each step.
### Components/Axes
The diagram consists of several text blocks connected by arrows, visually representing a logical flow. There are no explicit axes or scales. The diagram is organized into a series of steps, starting with the problem statement and progressing through the solution approach.
### Detailed Analysis or Content Details
**Top Block:**
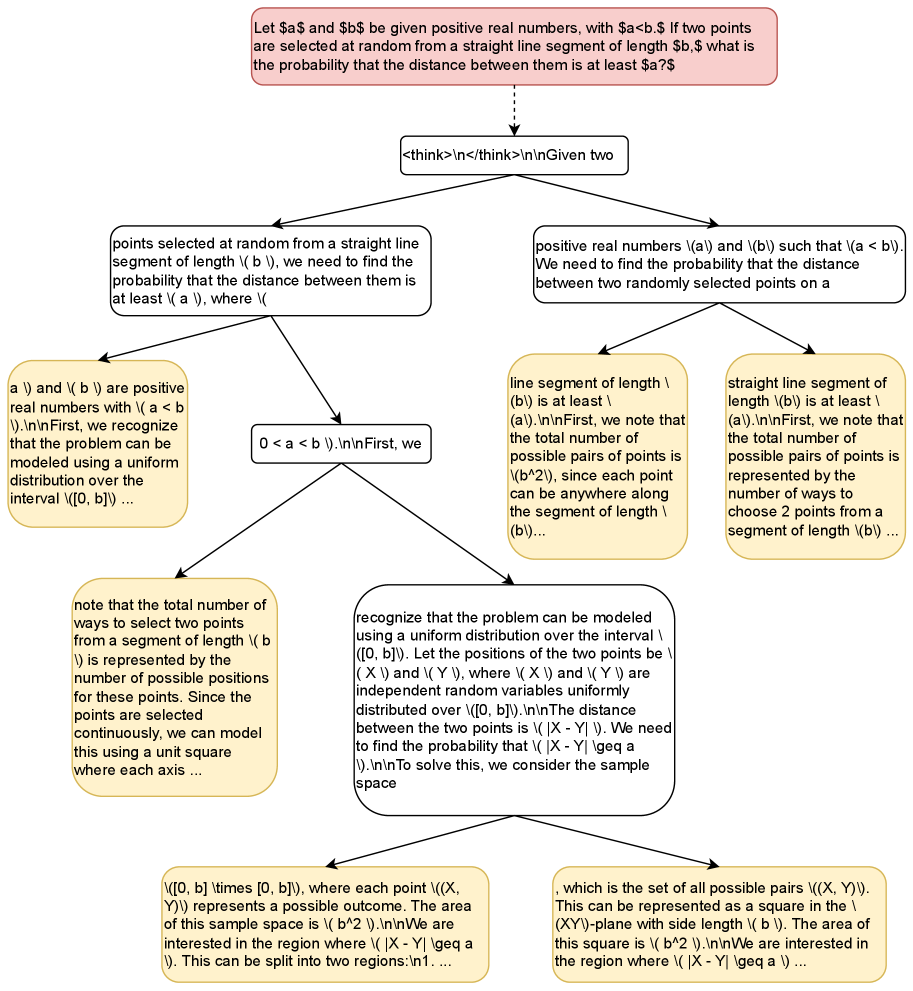
"Let $a$ and $b$ be given positive real numbers, with $a < b$. If two points are selected at random from a straight line segment of length $b$, what is the probability that the distance between them is at least $a$?"
**First Branch (Left):**
"points selected at random from a straight line segment of length (b), we need to find the probability that the distance between them is at least (a), where ("
"a) and (b) \ are positive real numbers with (a < b). \nInFirst, we recognize that the problem can be modeled using a uniform distribution over the interval (0, b)..."
A rectangle containing "0 < a < b" is present.
**First Branch (Right):**
"positive real numbers (a) and (b) such that (a < b). We need to find the probability that the distance between two randomly selected points on a"
"line segment of length (b) is at least (a). \nInFirst, we note that the total number of possible pairs of points is (b^2), since each point can be anywhere along the segment of length (b)..."
**Second Branch (Left):**
"note that the total number of ways to select two points from a segment of length (b) is represented by the number of possible positions for these points. Since the points are selected continuously, we can model this using a unit square where each axis..."
**Second Branch (Right):**
"recognize that the problem can be modeled using a uniform distribution over the interval (0, b). \nInFirst, Let the positions of the two points be (X) and (Y), where (X) and (Y) are independent random variables uniformly distributed over (0, b). \nInThe distance between the two points is |(X - Y)|. We need to find the probability that |(X - Y)| geq a. \nInTo solve this, we consider the sample space"
**Bottom Block:**
"(0, b) times (0, b), where each point ((X), (Y)) represents a possible outcome. The area of this sample space is (b^2). \nInWe are interested in the region where |(X - Y)| geq a. This region can be split into two regions: \nIn1. Are..."
"...which is the set of all possible pairs ((X), (Y)). This can be represented as a square in the XY-plane with side length (b). The area of this square is (b^2). \nInWe are interested in the region where..."
### Key Observations
The diagram presents a step-by-step approach to solving a probability problem using geometric and statistical concepts. The use of a uniform distribution and the representation of the problem as an area within a square are key elements of the solution. The problem is broken down into smaller, manageable steps, making it easier to understand.
### Interpretation
The diagram illustrates a common problem-solving technique in probability: translating a geometric problem into a statistical one. By representing the possible positions of the two points as coordinates in a square, the problem becomes one of finding the area of a specific region within that square. This area, when divided by the total area of the square, gives the desired probability. The diagram's structure emphasizes the logical flow of reasoning, starting with the problem statement and progressing through the steps needed to arrive at a solution. The use of mathematical notation and precise language indicates a technical audience familiar with probability and geometry. The diagram is a visual aid for understanding the solution process, rather than a presentation of numerical results.