## Line Chart: Invariance Penalty vs. Weight of Φ
### Overview
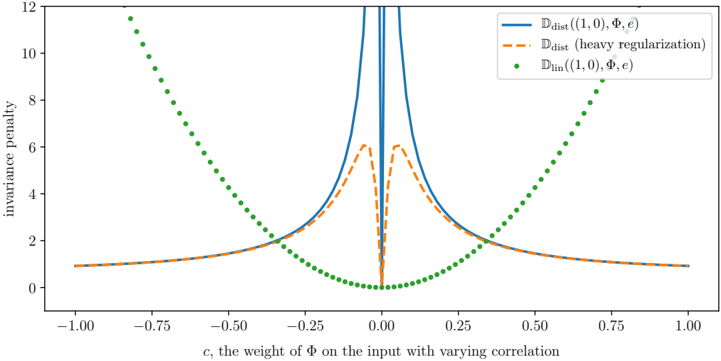
The image is a line chart comparing three different measures of invariance penalty as a function of 'c', the weight of Φ on the input with varying correlation. The chart displays three data series: Ddist((1, 0), Φ, e), Ddist (heavy regularization), and Dlin((1, 0), Φ, e).
### Components/Axes
* **X-axis:**
* Label: "c, the weight of Φ on the input with varying correlation"
* Scale: -1.00 to 1.00, with tick marks at -0.75, -0.50, -0.25, 0.00, 0.25, 0.50, 0.75, and 1.00.
* **Y-axis:**
* Label: "invariance penalty"
* Scale: 0 to 12, with tick marks at 2, 4, 6, 8, 10, and 12.
* **Legend:** Located in the top-right corner of the chart.
* Blue solid line: Ddist((1, 0), Φ, e)
* Orange dashed line: Ddist (heavy regularization)
* Green dotted line: Dlin((1, 0), Φ, e)
### Detailed Analysis
* **Ddist((1, 0), Φ, e) (Blue solid line):**
* Trend: Forms a sharp, narrow peak centered around c = 0. The penalty is very high near c = 0 and rapidly decreases as |c| increases.
* Approximate values:
* At c = 0, invariance penalty is approximately 12.
* At c = -0.1 and c = 0.1, invariance penalty is approximately 2.
* As c approaches -1 or 1, the invariance penalty approaches 1.
* **Ddist (heavy regularization) (Orange dashed line):**
* Trend: Forms a wider, less pronounced peak centered around c = 0 compared to the blue line. The penalty is lower than the blue line near c = 0 and approaches a constant value as |c| increases.
* Approximate values:
* At c = 0, invariance penalty is approximately 6.
* As c approaches -1 or 1, the invariance penalty approaches 1.
* **Dlin((1, 0), Φ, e) (Green dotted line):**
* Trend: Forms a U-shaped curve, decreasing from c = -1 to c = 0, then increasing from c = 0 to c = 1.
* Approximate values:
* At c = -1 and c = 1, invariance penalty is approximately 11.
* At c = 0, invariance penalty is approximately 0.
* At c = -0.5 and c = 0.5, invariance penalty is approximately 2.
### Key Observations
* Ddist((1, 0), Φ, e) exhibits the highest invariance penalty near c = 0.
* Ddist (heavy regularization) reduces the invariance penalty near c = 0 compared to Ddist((1, 0), Φ, e).
* Dlin((1, 0), Φ, e) has the lowest invariance penalty near c = 0 and increases as |c| moves away from 0.
### Interpretation
The chart illustrates how different methods of calculating invariance penalty behave as the weight 'c' of Φ on the input varies. The sharp peak in Ddist((1, 0), Φ, e) suggests a high sensitivity to changes in 'c' around 0. Heavy regularization reduces this sensitivity, as shown by the lower and wider peak in Ddist (heavy regularization). Dlin((1, 0), Φ, e) shows a different behavior, with the lowest penalty at c = 0 and increasing penalties as 'c' deviates from 0, suggesting it might be more robust to variations in 'c' away from the center. The data suggests that the choice of invariance penalty calculation method and the use of regularization can significantly impact the model's sensitivity to input variations.