\n
## Chart: Invariance Penalty vs. Correlation
### Overview
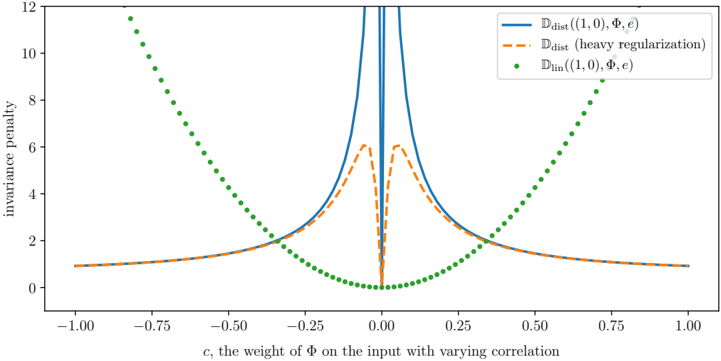
The image presents a line chart illustrating the relationship between invariance penalty and a correlation coefficient (c), representing the weight of Φ on the input. Three different curves are plotted, each representing a different distance metric or regularization technique.
### Components/Axes
* **X-axis Title:** c, the weight of Φ on the input with varying correlation. Scale ranges from -1.00 to 1.00, with markings at -0.75, -0.50, -0.25, 0.00, 0.25, 0.50, and 0.75.
* **Y-axis Title:** invariance penalty. Scale ranges from 0.0 to 12.0, with markings at 2, 4, 6, 8, 10, and 12.
* **Legend:** Located in the top-right corner.
* `Ddist((1,0),Φ,e)` - Solid Blue Line
* `Ddist (heavy regularization)` - Dashed Orange Line
* `Dlin((1,0),Φ,e)` - Dotted Green Line
### Detailed Analysis
* **Ddist((1,0),Φ,e) (Solid Blue Line):** This line exhibits a sharp, narrow peak centered around x = 0.0. The line starts at approximately y = 1.0 at x = -1.0, rapidly increases to a maximum of approximately y = 11.8 at x = 0.0, and then rapidly decreases back to approximately y = 1.0 at x = 1.0.
* **Ddist (heavy regularization) (Dashed Orange Line):** This line shows a broader, shallower peak also centered around x = 0.0. It starts at approximately y = 1.1 at x = -1.0, increases to a maximum of approximately y = 2.2 at x = 0.0, and then decreases back to approximately y = 1.1 at x = 1.0.
* **Dlin((1,0),Φ,e) (Dotted Green Line):** This line forms a U-shaped curve, with minimum values around x = -0.75 and x = 0.75. It starts at approximately y = 11.8 at x = -1.0, decreases to a minimum of approximately y = 0.2 at x = 0.0, and then increases back to approximately y = 11.8 at x = 1.0.
### Key Observations
* The `Ddist((1,0),Φ,e)` curve has the most pronounced peak, indicating a strong sensitivity to the correlation coefficient around zero.
* The `Ddist (heavy regularization)` curve is significantly flatter, suggesting that heavy regularization reduces the sensitivity to the correlation coefficient.
* The `Dlin((1,0),Φ,e)` curve exhibits a minimum at x = 0.0, indicating that the invariance penalty is lowest when the correlation coefficient is zero.
* All three curves are symmetrical around the y-axis.
### Interpretation
The chart demonstrates how different distance metrics and regularization techniques affect the invariance penalty as the correlation between input features changes. The sharp peak of `Ddist((1,0),Φ,e)` suggests that this metric is highly sensitive to the correlation, and any deviation from zero correlation results in a significant increase in the invariance penalty. The heavy regularization applied to `Ddist` mitigates this sensitivity, resulting in a flatter curve. The U-shaped curve of `Dlin((1,0),Φ,e)` indicates that this metric penalizes both positive and negative correlations, with the lowest penalty occurring when the correlation is zero. This suggests that `Dlin` encourages feature independence. The choice of metric and regularization technique will depend on the specific application and the desired trade-off between sensitivity to correlation and robustness to noise. The data suggests that heavy regularization can be used to stabilize the invariance penalty when using the `Ddist` metric.