## Line Chart: Invariance Penalty vs. Weight of Φ with Varying Correlation
### Overview
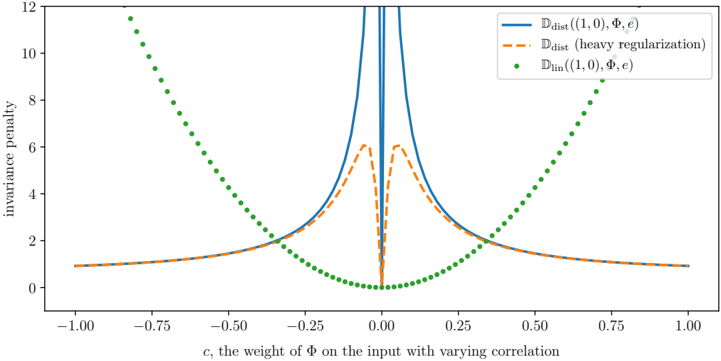
The chart illustrates the relationship between the invariance penalty and the weight parameter `c` (representing the weight of Φ on the input with varying correlation). Three distinct data series are plotted: two line-based distributions (`D_dist`) and a linear distribution (`D_lin`), each with unique visual characteristics (solid, dashed, dotted lines). The y-axis represents the magnitude of the invariance penalty, while the x-axis spans correlation values from -1.00 to 1.00.
### Components/Axes
- **X-axis**: Labeled "c, the weight of Φ on the input with varying correlation" with tick marks at -1.00, -0.75, -0.50, -0.25, 0.00, 0.25, 0.50, 0.75, and 1.00.
- **Y-axis**: Labeled "invariance penalty" with values ranging from 0 to 12 in increments of 2.
- **Legend**: Located in the top-right corner, with three entries:
- Solid blue line: `D_dist((1, 0), Φ, ε)`
- Dashed orange line: `D_dist(heavy regularization)`
- Dotted green line: `D_lin((1, 0), ε)`
### Detailed Analysis
1. **Solid Blue Line (`D_dist((1, 0), Φ, ε)`)**:
- Sharp peak at `c = 0.00` with a maximum y-value of approximately 12.
- Rapidly declines to near-zero values as `c` moves away from 0 in both directions.
- Symmetrical shape with steep slopes on either side of the peak.
2. **Dashed Orange Line (`D_dist(heavy regularization)`)**:
- Broader peak centered at `c = 0.00`, with a maximum y-value of ~6.
- Gradual decline on both sides of the peak, less steep than the blue line.
- Symmetrical but flatter compared to the blue line.
3. **Dotted Green Line (`D_lin((1, 0), ε)`)**:
- U-shaped curve with a minimum at `c = 0.00` (y ≈ 0).
- Increases symmetrically as `c` moves toward ±1.00, reaching ~12 at the extremes.
- No sharp peaks; smooth parabolic trend.
### Key Observations
- All three data series exhibit symmetry around `c = 0.00`, suggesting a central role for zero correlation in minimizing the invariance penalty.
- The blue line (`D_dist`) shows the highest sensitivity to `c`, with the sharpest peak and steepest slopes.
- The orange line (`D_dist` with heavy regularization) demonstrates reduced sensitivity, with a broader peak and lower maximum penalty.
- The green line (`D_lin`) exhibits the least sensitivity, with a quadratic relationship between `c` and the penalty.
### Interpretation
The data suggests that the invariance penalty is most sensitive to the weight `c` when the correlation is zero (`c = 0.00`). The sharp peak of the blue line (`D_dist`) indicates that this distribution is highly dependent on precise alignment of `c` with zero correlation. The broader peak of the orange line (`D_dist` with heavy regularization) implies that regularization mitigates sensitivity to small deviations in `c`, making it more robust. The green line (`D_lin`) reveals a fundamentally different relationship, where the penalty increases quadratically as `c` moves away from zero, suggesting a linear model's inherent trade-off between input weighting and invariance.
Notably, the blue and orange lines both peak at `c = 0.00`, but their differing shapes highlight the impact of regularization on model behavior. The green line’s U-shape underscores a baseline penalty that grows with input weighting, independent of correlation alignment. These trends may reflect trade-offs between model complexity, regularization, and input dependency in the system being modeled.