TECHNICAL ASSET FINGERPRINT
7dbbaf62459adccc53a35822
Click to view fullscreen
Press ESC or click to close
FOUND IN PAPERS
EXPERT: gemini-2.0-flash VERSION 1
RUNTIME: nugit/gemini/gemini-2.0-flash
INTEL_VERIFIED
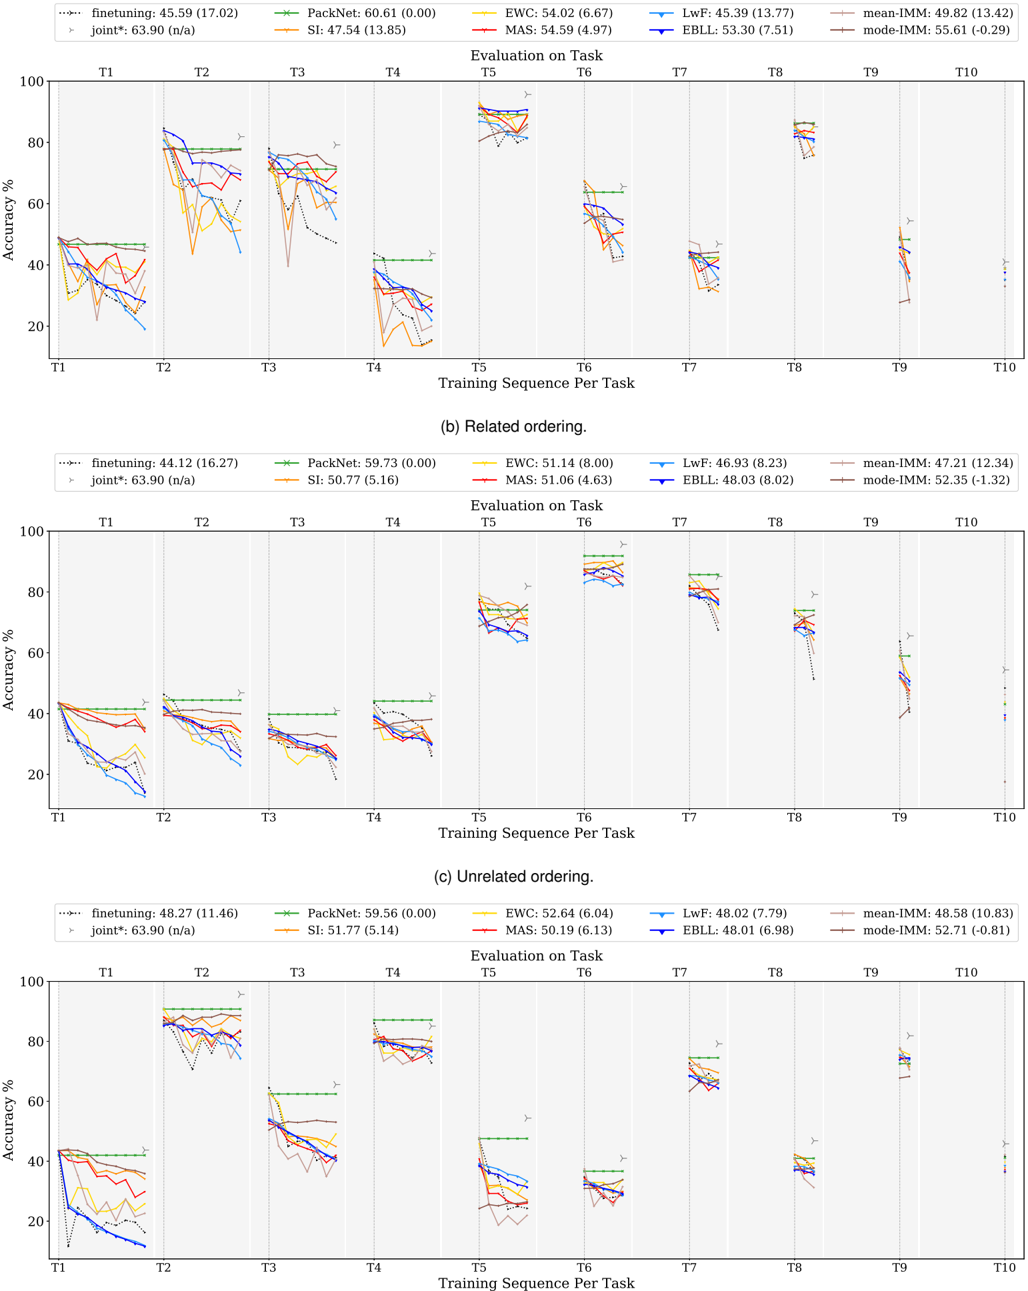
## Line Charts: Performance Comparison of Continual Learning Strategies
### Overview
The image presents three line charts comparing the performance of different continual learning strategies across a sequence of tasks. The charts depict the accuracy (%) of each strategy as the training sequence progresses from task T1 to T10. The three charts represent different task orderings: the top chart (a) is not explicitly labeled, the middle chart (b) shows "Related ordering," and the bottom chart (c) shows "Unrelated ordering." Each chart includes multiple lines, each representing a different continual learning strategy.
### Components/Axes
* **Y-axis:** Accuracy (%), ranging from 0 to 100.
* **X-axis:** Training Sequence Per Task, labeled from T1 to T10.
* **Title of X-axis:** Evaluation on Task, labeled from T5 to T6.
* **Legends (Located at the top of each chart):**
* finetuning: Dotted line, dark blue.
* joint*: Dotted line with triangle markers, black.
* PackNet: Solid line, green.
* SI: Solid line, orange.
* EWC: Solid line, yellow.
* MAS: Solid line, red.
* LwF: Solid line, light blue.
* EBLL: Solid line, dark blue.
* mean-IMM: Solid line, gray.
* mode-IMM: Solid line, brown.
### Detailed Analysis
**Chart (a) - Unlabeled Ordering**
* **finetuning:** Starts at approximately 45% at T1, drops sharply to around 20% by T2, and fluctuates between 20% and 30% for subsequent tasks. Value: 45.59 (17.02)
* **joint*:** Starts at approximately 64% at T1 and remains constant across all tasks. Value: 63.90 (n/a)
* **PackNet:** Starts at approximately 61% at T1, drops to around 40% by T4, and then stabilizes. Value: 60.61 (0.00)
* **SI:** Starts at approximately 48% at T1, drops to around 30% by T4, and then stabilizes. Value: 47.54 (13.85)
* **EWC:** Starts at approximately 54% at T1, drops to around 30% by T4, and then stabilizes. Value: 54.02 (6.67)
* **MAS:** Starts at approximately 55% at T1, drops to around 30% by T4, and then stabilizes. Value: 54.59 (4.97)
* **LwF:** Starts at approximately 45% at T1, drops to around 30% by T4, and then stabilizes. Value: 45.39 (13.77)
* **EBLL:** Starts at approximately 53% at T1, drops to around 30% by T4, and then stabilizes. Value: 53.30 (7.51)
* **mean-IMM:** Starts at approximately 50% at T1, drops to around 30% by T4, and then stabilizes. Value: 49.82 (13.42)
* **mode-IMM:** Starts at approximately 56% at T1, drops to around 40% by T4, and then stabilizes. Value: 55.61 (-0.29)
**Chart (b) - Related Ordering**
* **finetuning:** Starts at approximately 44% at T1, drops sharply to around 10% by T2, and fluctuates between 10% and 20% for subsequent tasks. Value: 44.12 (16.27)
* **joint*:** Starts at approximately 64% at T1 and remains constant across all tasks. Value: 63.90 (n/a)
* **PackNet:** Starts at approximately 60% at T1, remains relatively stable. Value: 59.73 (0.00)
* **SI:** Starts at approximately 51% at T1, drops to around 30% by T4, and then stabilizes. Value: 50.77 (5.16)
* **EWC:** Starts at approximately 51% at T1, drops to around 30% by T4, and then stabilizes. Value: 51.14 (8.00)
* **MAS:** Starts at approximately 51% at T1, drops to around 30% by T4, and then stabilizes. Value: 51.06 (4.63)
* **LwF:** Starts at approximately 47% at T1, drops to around 30% by T4, and then stabilizes. Value: 46.93 (8.23)
* **EBLL:** Starts at approximately 48% at T1, drops to around 30% by T4, and then stabilizes. Value: 48.03 (8.02)
* **mean-IMM:** Starts at approximately 47% at T1, drops to around 30% by T4, and then stabilizes. Value: 47.21 (12.34)
* **mode-IMM:** Starts at approximately 52% at T1, drops to around 40% by T4, and then stabilizes. Value: 52.35 (-1.32)
**Chart (c) - Unrelated Ordering**
* **finetuning:** Starts at approximately 48% at T1, drops sharply to around 10% by T2, and fluctuates between 10% and 20% for subsequent tasks. Value: 48.27 (11.46)
* **joint*:** Starts at approximately 64% at T1 and remains constant across all tasks. Value: 63.90 (n/a)
* **PackNet:** Starts at approximately 60% at T1, remains relatively stable. Value: 59.56 (0.00)
* **SI:** Starts at approximately 52% at T1, drops to around 30% by T4, and then stabilizes. Value: 51.77 (5.14)
* **EWC:** Starts at approximately 53% at T1, drops to around 30% by T4, and then stabilizes. Value: 52.64 (6.04)
* **MAS:** Starts at approximately 50% at T1, drops to around 30% by T4, and then stabilizes. Value: 50.19 (6.13)
* **LwF:** Starts at approximately 48% at T1, drops to around 30% by T4, and then stabilizes. Value: 48.02 (7.79)
* **EBLL:** Starts at approximately 48% at T1, drops to around 30% by T4, and then stabilizes. Value: 48.01 (6.98)
* **mean-IMM:** Starts at approximately 49% at T1, drops to around 30% by T4, and then stabilizes. Value: 48.58 (10.83)
* **mode-IMM:** Starts at approximately 53% at T1, drops to around 40% by T4, and then stabilizes. Value: 52.71 (-0.81)
### Key Observations
* The "joint*" strategy consistently maintains the highest accuracy across all tasks and orderings.
* The "finetuning" strategy experiences a significant drop in accuracy after the first few tasks, indicating catastrophic forgetting.
* Strategies like "PackNet" show more stable performance compared to "finetuning," but still exhibit some decline over time.
* The performance of most strategies stabilizes after the fourth task.
* The task ordering ("Related" vs. "Unrelated") seems to have a minor impact on the overall trends, but the relative performance of the strategies remains consistent.
### Interpretation
The charts demonstrate the challenges of continual learning, where models struggle to maintain performance on previously learned tasks as they learn new ones. The "joint*" strategy, which likely involves training on all tasks simultaneously, serves as an upper bound for performance. The "finetuning" strategy highlights the problem of catastrophic forgetting. Other strategies like "PackNet," "SI," "EWC," "MAS," "LwF," "EBLL," "mean-IMM," and "mode-IMM" represent different approaches to mitigate forgetting, with varying degrees of success. The relatively stable performance of "PackNet" suggests it is more robust to catastrophic forgetting than "finetuning." The similarity in trends across different task orderings suggests that the specific order of tasks has a limited impact on the overall performance of these strategies.
DECODING INTELLIGENCE...