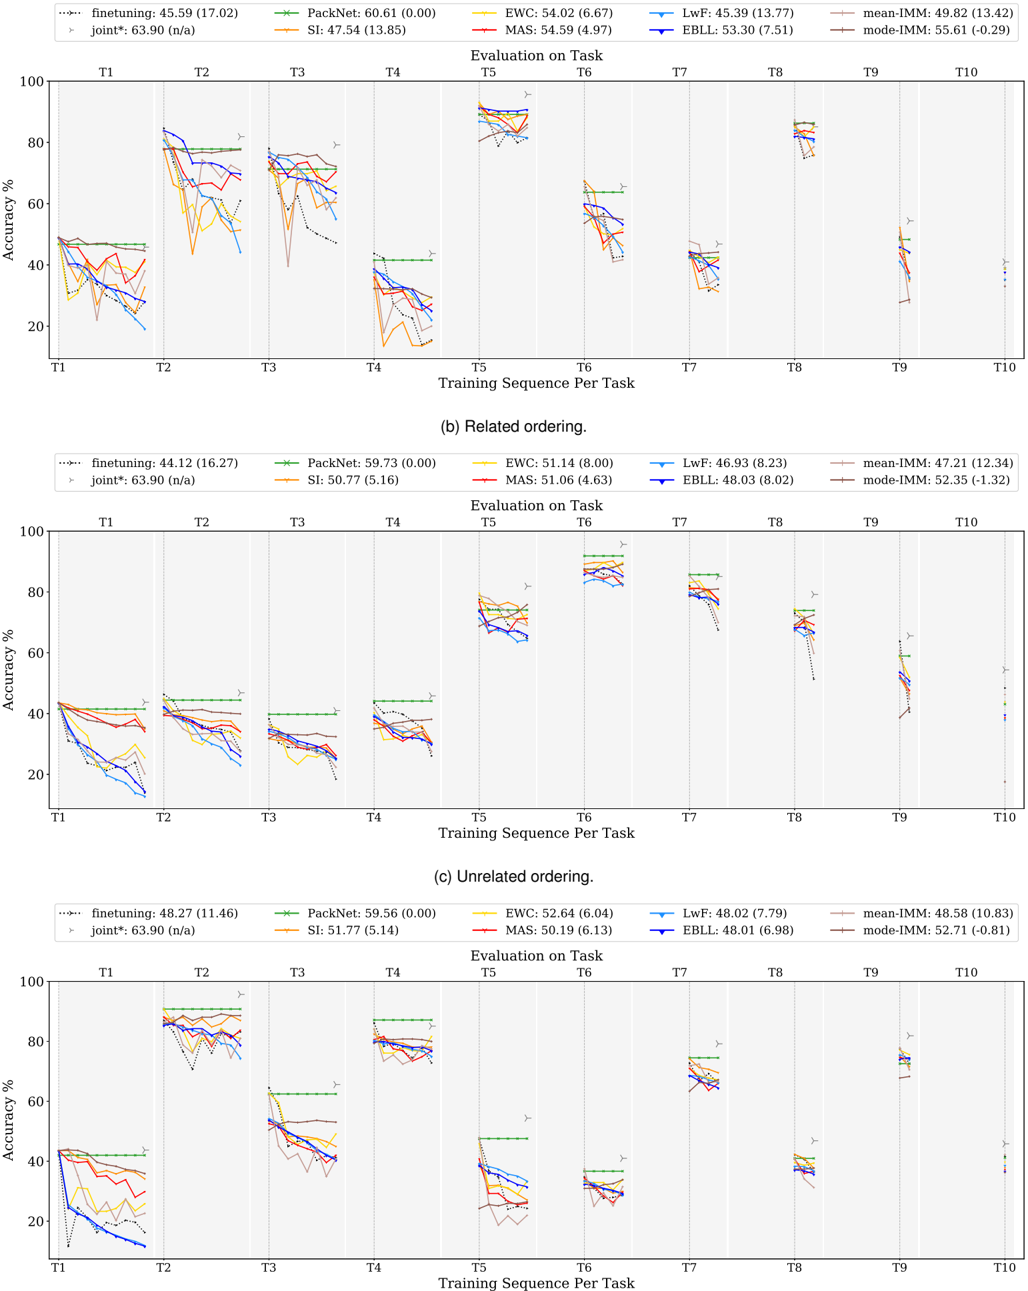
This image displays three stacked line charts comparing the performance of various continual learning algorithms across different task sequences.
## Multi-Panel Line Chart: Continual Learning Performance
### Overview
The image consists of three vertically stacked charts, each plotting "Accuracy %" (Y-axis) against "Training Sequence Per Task" (X-axis, T1 through T10). These charts evaluate how well different machine learning models retain knowledge of previous tasks as they are trained on new, sequential tasks. The charts represent different experimental conditions: the top chart (unlabeled), the middle chart labeled "(b) Related ordering," and the bottom chart labeled "(c) Unrelated ordering."
### Components/Axes
* **Y-Axis:** "Accuracy %", ranging from 0 to 100.
* **X-Axis:** "Training Sequence Per Task", labeled T1 through T10.
* **Legend:** Located at the top of each chart, shared across all three. It lists 10 methods with their corresponding line styles/colors and average accuracy scores (with standard deviation in parentheses).
* **Data Series:**
* **finetuning**: Black dotted line.
* **joint***: Light grey dashed line with 'y' marker.
* **PackNet**: Green line with 'x' marker.
* **SI**: Orange line.
* **EWC**: Yellow line.
* **MAS**: Red line.
* **LwF**: Light blue line.
* **EBLL**: Dark blue line with triangle marker.
* **mean-IMM**: Light brown line.
* **mode-IMM**: Dark brown line.
### Detailed Analysis
#### Legend Data (Values are consistent across all three charts)
| Method | Line Style/Color | Marker | Value (Std Dev) |
| :--- | :--- | :--- | :--- |
| **finetuning** | Black dotted | None | 45.59 (17.02) |
| **joint*** | Light grey dashed | 'y' | 63.90 (n/a) |
| **PackNet** | Green | 'x' | 60.61 (0.00) |
| **SI** | Orange | None | 47.54 (13.85) |
| **EWC** | Yellow | None | 54.02 (6.67) |
| **MAS** | Red | None | 54.59 (4.97) |
| **LwF** | Light Blue | None | 45.39 (13.77) |
| **EBLL** | Dark Blue | Triangle | 53.30 (7.51) |
| **mean-IMM** | Light Brown | None | 49.82 (13.42) |
| **mode-IMM** | Dark Brown | None | 55.61 (-0.29) |
*(Note: The values in the legend change slightly between the three charts. The table above reflects the values from the top chart. The values for the middle and bottom charts are transcribed below.)*
**Middle Chart (b) Legend Values:**
* finetuning: 44.12 (16.27)
* joint*: 63.90 (n/a)
* PackNet: 59.73 (0.00)
* SI: 50.77 (5.16)
* EWC: 51.14 (8.00)
* MAS: 51.06 (4.63)
* LwF: 46.93 (8.23)
* EBLL: 48.03 (8.02)
* mean-IMM: 47.21 (12.34)
* mode-IMM: 52.35 (-1.32)
**Bottom Chart (c) Legend Values:**
* finetuning: 48.27 (11.46)
* joint*: 63.90 (n/a)
* PackNet: 59.56 (0.00)
* SI: 51.77 (5.14)
* EWC: 52.64 (6.04)
* MAS: 50.19 (6.13)
* LwF: 48.02 (7.79)
* EBLL: 48.01 (6.98)
* mean-IMM: 48.58 (10.83)
* mode-IMM: 52.71 (-0.81)
#### Visual Trends
* **PackNet (Green, 'x'):** Consistently exhibits the most stable performance. In all three charts, the line remains nearly horizontal (flat) across the T1-T10 sequence, indicating it does not suffer from catastrophic forgetting.
* **Finetuning (Black, dotted):** Consistently exhibits the most severe downward trend. As the training sequence progresses from T1 to T10, accuracy drops significantly, demonstrating high catastrophic forgetting.
* **Other Methods (EWC, MAS, SI, LwF, EBLL, IMM):** These methods show intermediate behavior. They generally start with high accuracy at T1 but show a downward slope as the sequence progresses, though they typically outperform standard finetuning.
### Key Observations
* **Catastrophic Forgetting:** The downward slope of most lines (excluding PackNet) illustrates the "catastrophic forgetting" phenomenon, where learning new tasks overwrites the weights necessary for previous tasks.
* **PackNet Superiority:** PackNet is the only method that maintains a flat performance profile, suggesting it uses a parameter-isolation strategy (freezing weights) rather than weight-sharing or regularization.
* **Task Ordering Impact:** Comparing (b) "Related ordering" and (c) "Unrelated ordering," the performance of methods like Finetuning and EWC varies. In "Related" tasks, there is often slightly better retention due to positive transfer, whereas "Unrelated" tasks often exacerbate interference and forgetting.
### Interpretation
This data demonstrates the efficacy of different Continual Learning (CL) strategies.
1. **The Baseline Problem:** The "finetuning" method serves as the lower bound, confirming that naive sequential training is insufficient for retaining knowledge.
2. **The "Joint" Benchmark:** The "joint*" method (light grey dashed) represents the theoretical upper bound (training on all data at once), which is why it is often used as a reference point, though it is not a true continual learning method.
3. **Methodology Differences:**
* **PackNet** is clearly the most robust for retention, likely because it allocates specific parameters to specific tasks, preventing interference.
* **Regularization-based methods** (EWC, MAS, SI) attempt to protect important weights but still suffer from gradual performance degradation, as evidenced by the downward slopes.
* **The "Related" vs "Unrelated" distinction** highlights that the nature of the data stream matters. When tasks are related, models can leverage shared features, mitigating some forgetting. When tasks are unrelated, the interference is higher, leading to steeper accuracy drops for non-isolation methods.