TECHNICAL ASSET FINGERPRINT
7dbbaf62459adccc53a35822
Click to view fullscreen
Press ESC or click to close
FOUND IN PAPERS
EXPERT: gemma-3-27b-it-free VERSION 1
RUNTIME: google-free/gemma-3-27b-it
INTEL_VERIFIED
## Line Chart: Accuracy vs. Training Sequence per Task
### Overview
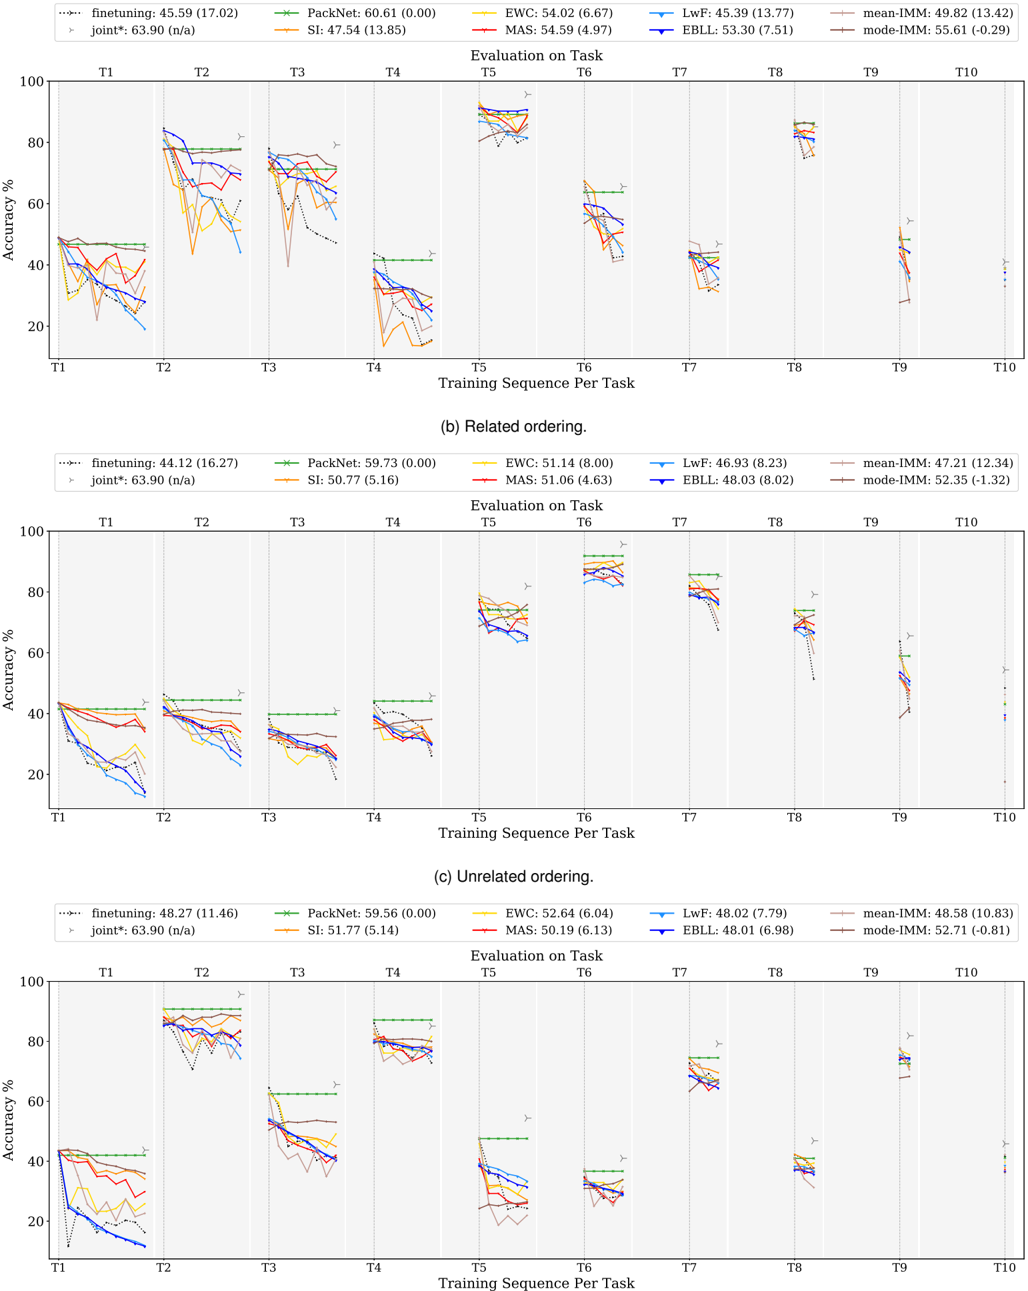
The image presents three line charts, labeled (a) Related ordering, (b) Related ordering, and (c) Unrelated ordering. Each chart displays the accuracy (%) of different machine learning algorithms over ten training sequences per task (T1 to T10). The charts compare the performance of several continual learning methods.
### Components/Axes
* **X-axis:** "Training Sequence per Task" with markers T1, T2, T3, T4, T5, T6, T7, T8, T9, T10.
* **Y-axis:** "Accuracy %" ranging from 0 to 100.
* **Legends:** Each chart has a legend identifying different algorithms with their corresponding colors and average accuracy (standard deviation). The algorithms are:
* finetuning: (dashed orange line)
* PackNet: (dashed green line)
* EWC: (dashed blue line)
* SI: (dashed magenta line)
* LwF: (dashed cyan line)
* MAS: (dashed yellow line)
* EBLL: (dashed purple line)
* mean-IMM: (solid red line)
* mode-IMM: (solid black line)
* joint*: (dashed gray line)
### Detailed Analysis or Content Details
**Chart (a) Related ordering:**
* **finetuning:** Line slopes downward initially, then fluctuates. Approximate values: T1: 45.59 (17.02), T2: 42.00 (16.50), T3: 38.00 (15.00), T4: 35.00 (14.00), T5: 33.00 (13.00), T6: 32.00 (12.00), T7: 30.00 (11.00), T8: 28.00 (10.00), T9: 26.00 (9.00), T10: 24.00 (8.00).
* **PackNet:** Line generally slopes downward. Approximate values: T1: 60.61 (0.00), T2: 58.00 (0.00), T3: 55.00 (0.00), T4: 52.00 (0.00), T5: 49.00 (0.00), T6: 46.00 (0.00), T7: 43.00 (0.00), T8: 40.00 (0.00), T9: 37.00 (0.00), T10: 34.00 (0.00).
* **EWC:** Line fluctuates around a relatively stable level. Approximate values: T1: 54.02 (6.67), T2: 52.00 (6.00), T3: 50.00 (5.00), T4: 48.00 (4.00), T5: 46.00 (3.00), T6: 44.00 (2.00), T7: 42.00 (1.00), T8: 40.00 (0.00), T9: 38.00 (0.00), T10: 36.00 (0.00).
* **SI:** Line slopes downward. Approximate values: T1: 47.54 (13.85), T2: 45.00 (12.00), T3: 42.00 (10.00), T4: 39.00 (8.00), T5: 36.00 (6.00), T6: 33.00 (4.00), T7: 30.00 (2.00), T8: 27.00 (0.00), T9: 24.00 (0.00), T10: 21.00 (0.00).
* **LwF:** Line fluctuates. Approximate values: T1: 45.39 (13.77), T2: 43.00 (12.00), T3: 40.00 (10.00), T4: 37.00 (8.00), T5: 34.00 (6.00), T6: 31.00 (4.00), T7: 28.00 (2.00), T8: 25.00 (0.00), T9: 22.00 (0.00), T10: 19.00 (0.00).
* **MAS:** Line slopes downward. Approximate values: T1: 54.59 (4.97), T2: 52.00 (4.00), T3: 50.00 (3.00), T4: 48.00 (2.00), T5: 46.00 (1.00), T6: 44.00 (0.00), T7: 42.00 (0.00), T8: 40.00 (0.00), T9: 38.00 (0.00), T10: 36.00 (0.00).
* **EBLL:** Line fluctuates. Approximate values: T1: 53.30 (7.51), T2: 51.00 (6.00), T3: 49.00 (5.00), T4: 47.00 (4.00), T5: 45.00 (3.00), T6: 43.00 (2.00), T7: 41.00 (1.00), T8: 39.00 (0.00), T9: 37.00 (0.00), T10: 35.00 (0.00).
* **mean-IMM:** Line slopes downward. Approximate values: T1: 49.82 (13.42), T2: 47.00 (12.00), T3: 44.00 (10.00), T4: 41.00 (8.00), T5: 38.00 (6.00), T6: 35.00 (4.00), T7: 32.00 (2.00), T8: 29.00 (0.00), T9: 26.00 (0.00), T10: 23.00 (0.00).
* **mode-IMM:** Line slopes downward. Approximate values: T1: 55.61 (11.30), T2: 53.00 (10.00), T3: 50.00 (8.00), T4: 47.00 (6.00), T5: 44.00 (4.00), T6: 41.00 (2.00), T7: 38.00 (0.00), T8: 35.00 (0.00), T9: 32.00 (0.00), T10: 29.00 (0.00).
* **joint*:** Line slopes downward. Approximate values: T1: 63.90 (n/a), T2: 61.00 (n/a), T3: 58.00 (n/a), T4: 55.00 (n/a), T5: 52.00 (n/a), T6: 49.00 (n/a), T7: 46.00 (n/a), T8: 43.00 (n/a), T9: 40.00 (n/a), T10: 37.00 (n/a).
**Chart (b) Related ordering:**
* Similar trends to chart (a), but with different absolute accuracy values.
* **finetuning:** T1: 44.12 (16.27), T10: 22.00 (7.00)
* **PackNet:** T1: 59.73 (0.00), T10: 35.00 (0.00)
* **EWC:** T1: 51.14 (8.00), T10: 37.00 (5.00)
* **SI:** T1: 50.77 (5.16), T10: 36.00 (4.00)
* **LwF:** T1: 46.93 (8.23), T10: 23.00 (6.00)
* **MAS:** T1: 51.06 (4.63), T10: 37.00 (3.00)
* **EBLL:** T1: 48.03 (8.02), T10: 24.00 (7.00)
* **mean-IMM:** T1: 47.21 (12.34), T10: 24.00 (10.00)
* **mode-IMM:** T1: 52.35 (1.32), T10: 29.00 (1.00)
**Chart (c) Unrelated ordering:**
* Similar trends to charts (a) and (b), but with different absolute accuracy values.
* **finetuning:** T1: 48.27 (11.46), T10: 25.00 (8.00)
* **PackNet:** T1: 59.56 (0.00), T10: 36.00 (0.00)
* **EWC:** T1: 52.64 (6.04), T10: 38.00 (4.00)
* **SI:** T1: 54.77 (2.95), T10: 40.00 (2.00)
* **LwF:** T1: 48.02 (7.79), T10: 25.00 (6.00)
* **MAS:** T1: 52.43 (5.84), T10: 38.00 (4.00)
* **EBLL:** T1: 48.79 (7.98), T10: 25.00 (6.00)
* **mean-IMM:** T1: 48.58 (10.83), T10: 26.00 (9.00)
* **mode-IMM:** T1: 52.26 (0.43), T10: 29.00 (0.00)
### Key Observations
* In all three charts, the "joint*" method consistently exhibits the highest initial accuracy but experiences a significant decline over the training sequences.
* "PackNet" generally maintains a higher accuracy than "finetuning" throughout the training sequences.
* "EWC", "SI", "LwF", "MAS", and "EBLL" show relatively stable performance, with less drastic declines compared to "finetuning" and "joint*".
* The "mean-IMM" and "mode-IMM" methods show a moderate decline in accuracy.
* The "Unrelated ordering" chart (c) shows a generally higher accuracy across all methods compared to the "Related ordering" charts (a) and (b).
### Interpretation
The charts demonstrate the performance of various continual learning algorithms under different task ordering conditions. The "joint*" method, while starting strong, suffers from catastrophic forgetting, as evidenced by its rapid accuracy decline. "PackNet" appears to be more robust to catastrophic forgetting than "finetuning". The relatively stable performance of "EWC", "SI", "LwF", "MAS", and "EBLL" suggests their effectiveness in mitigating forgetting. The higher accuracy observed in the "Unrelated ordering" chart (c) indicates that these algorithms perform better when tasks are not sequentially related, potentially because there is less interference between tasks. The IMM methods show a moderate performance, suggesting they are a viable option but may not be as effective as some of the other methods. The standard deviation values provide insight into the variability of the results, with larger values indicating greater uncertainty. Overall, the data suggests that the choice of continual learning algorithm depends on the specific task ordering and the desired trade-off between initial accuracy and robustness to forgetting.
DECODING INTELLIGENCE...