TECHNICAL ASSET FINGERPRINT
7dbbaf62459adccc53a35822
Click to view fullscreen
Press ESC or click to close
FOUND IN PAPERS
EXPERT: healer-alpha-free VERSION 1
RUNTIME: free/openrouter/healer-alpha
INTEL_VERIFIED
## Line Charts: Continual Learning Method Performance Across Task Sequences
### Overview
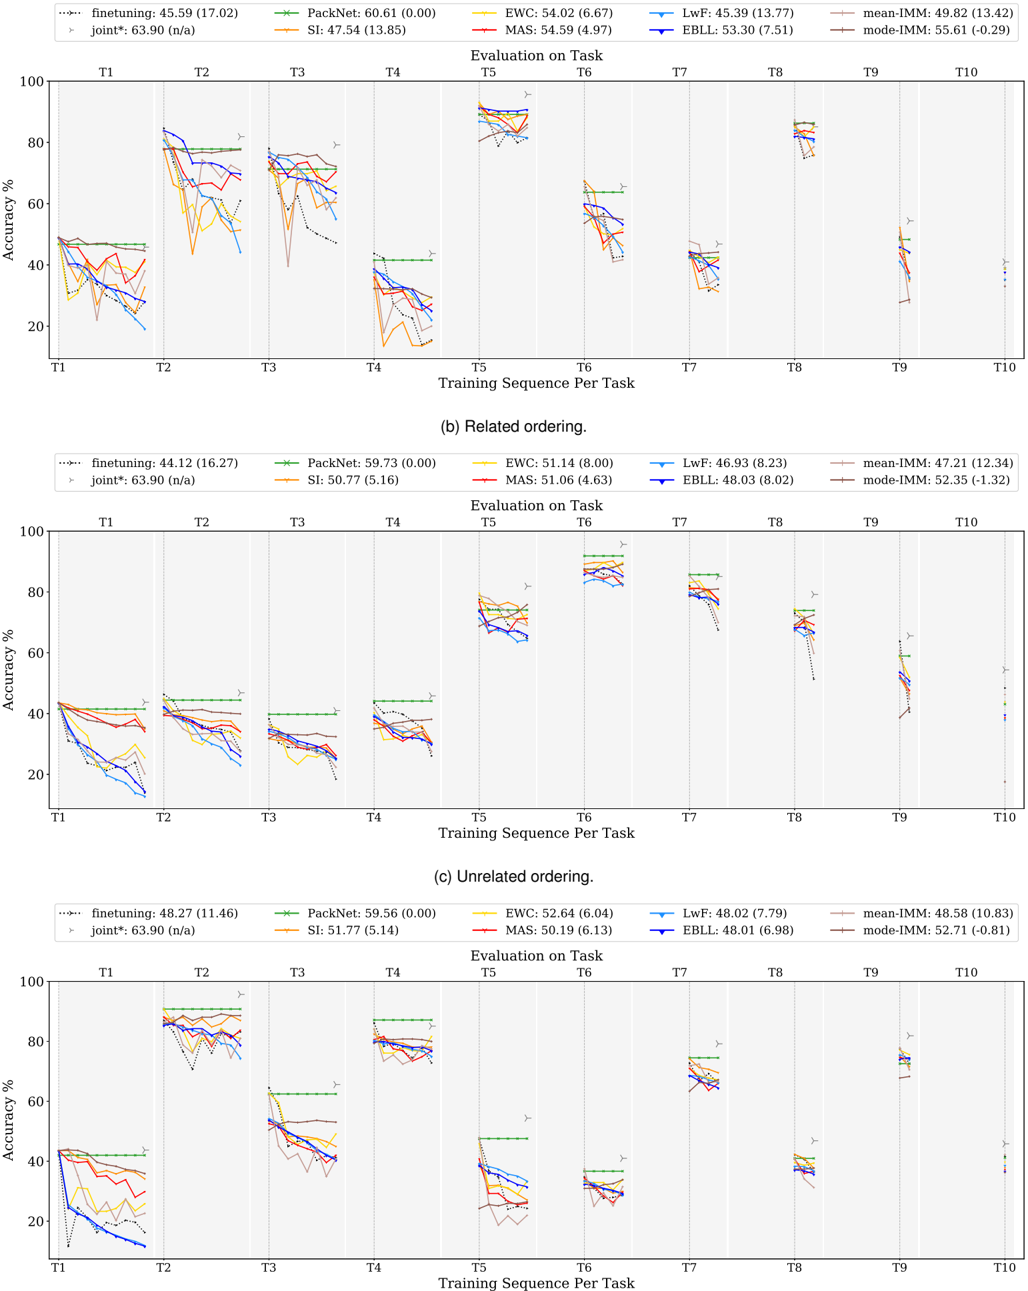
The image contains three separate line charts, labeled (a), (b), and (c), comparing the performance of various continual learning methods. Each chart plots "Accuracy %" (y-axis) against a "Training Sequence Per Task" (x-axis, tasks T1 through T10). The charts differ by the ordering of the tasks: (a) uses a "Related ordering," (b) uses a "Related ordering" (note: this appears to be a duplicate label in the source image, but the data differs), and (c) uses an "Unrelated ordering." Each chart includes a legend at the top listing the methods and their average accuracy (with standard deviation in parentheses).
### Components/Axes
* **Y-Axis:** Labeled "Accuracy %". Scale runs from 0 to 100 in increments of 20.
* **X-Axis:** Labeled "Training Sequence Per Task". Discrete markers for tasks T1, T2, T3, T4, T5, T6, T7, T8, T9, T10.
* **Legend (Common to all charts, positioned at top center):**
* `finetuning`: Dotted black line. Avg. Acc: Varies per chart.
* `joint*`: Gray right-pointing triangle marker. Avg. Acc: 63.90 (n/a) - This is a fixed baseline.
* `PackNet`: Green line with plus (+) markers. Avg. Acc: Varies per chart.
* `SI`: Orange line. Avg. Acc: Varies per chart.
* `EWC`: Yellow line. Avg. Acc: Varies per chart.
* `MAS`: Red line. Avg. Acc: Varies per chart.
* `LwF`: Light blue line. Avg. Acc: Varies per chart.
* `EBLL`: Dark blue line. Avg. Acc: Varies per chart.
* `mean-iMM`: Brown line. Avg. Acc: Varies per chart.
* `mode-iMM`: Gray line. Avg. Acc: Varies per chart.
### Detailed Analysis
#### Chart (a): Related ordering.
* **Legend Data:**
* finetuning: 45.59 (17.02)
* PackNet: 60.61 (0.00)
* EWC: 54.02 (6.67)
* LwF: 45.39 (13.77)
* mean-iMM: 49.82 (13.42)
* SI: 47.54 (13.85)
* MAS: 54.59 (4.97)
* EBLL: 53.30 (7.51)
* mode-iMM: 55.61 (-0.29)
* **Trend Verification & Data Points:**
* **PackNet (Green):** Maintains a consistently high, flat line near 80% accuracy from T2 onward, showing no catastrophic forgetting. It starts around 45% at T1.
* **joint* (Gray Triangle):** A single high point near 90% at T5, representing an upper-bound baseline.
* **Other Methods:** All show a general downward trend in accuracy as more tasks are learned (from left to right). Performance on early tasks (T1, T2) is often higher (60-80%) but degrades significantly for later tasks (T8, T9, T10), often dropping below 40%. There is high variance between methods at each task point. For example, at T4, accuracies range from ~20% (some methods) to ~40% (PackNet).
#### Chart (b): Related ordering. (Second instance)
* **Legend Data:**
* finetuning: 44.12 (16.27)
* PackNet: 59.73 (0.00)
* EWC: 51.14 (8.00)
* LwF: 46.93 (8.23)
* mean-iMM: 47.21 (12.34)
* SI: 50.77 (5.16)
* MAS: 51.06 (4.63)
* EBLL: 48.03 (8.02)
* mode-iMM: 52.35 (-1.32)
* **Trend Verification & Data Points:**
* **PackNet (Green):** Again shows a stable, high-performance line, hovering around 80% from T2 to T7, before a slight decline.
* **joint* (Gray Triangle):** High point near 85% at T6.
* **Other Methods:** Similar downward trend as in chart (a). Initial performance (T1, T2) is clustered between 40-50%. A notable drop occurs for most methods at T3 and T4. Performance recovers somewhat at T5 and T6 before declining again. The spread between methods is less pronounced than in chart (a).
#### Chart (c): Unrelated ordering.
* **Legend Data:**
* finetuning: 48.27 (11.46)
* PackNet: 59.56 (0.00)
* EWC: 52.64 (6.04)
* LwF: 48.02 (7.79)
* mean-iMM: 48.58 (10.83)
* SI: 51.77 (5.14)
* MAS: 50.19 (6.13)
* EBLL: 48.01 (6.98)
* mode-iMM: 52.71 (-0.81)
* **Trend Verification & Data Points:**
* **PackNet (Green):** Maintains its characteristic stable, high line, though it shows a more noticeable step-down pattern, dropping at T5 and again at T8.
* **joint* (Gray Triangle):** High point near 80% at T2.
* **Other Methods:** The performance pattern is more erratic. There are sharp drops (e.g., at T2 for many methods) and partial recoveries (e.g., at T4). The overall trend is still downward, but with more volatility compared to the "Related ordering" charts. Final performance at T9/T10 is generally low, clustered between 20-40%.
### Key Observations
1. **PackNet's Stability:** Across all three task orderings, PackNet (green line) demonstrates remarkable stability, maintaining high accuracy with near-zero standard deviation (0.00 in all legends), indicating it suffers negligible catastrophic forgetting.
2. **General Forgetting Trend:** All other methods exhibit the classic continual learning challenge: accuracy on previously learned tasks degrades as new tasks are added (lines slope downward from left to right).
3. **Impact of Task Ordering:** The "Related ordering" charts (a, b) show somewhat smoother degradation curves compared to the more volatile "Unrelated ordering" chart (c), suggesting task similarity influences learning dynamics.
4. **Baseline Comparison:** The `joint*` marker (trained on all tasks simultaneously) consistently sits at the top of the charts (80-90% range), serving as an upper-bound performance target that sequential methods approach but do not reach.
5. **Method Clustering:** In later tasks (T8-T10), the performance of most methods (excluding PackNet) converges into a lower band (20-50%), showing similar limitations in long sequential learning.
### Interpretation
This data visualizes the core problem of catastrophic forgetting in neural networks and evaluates different algorithmic solutions. The charts demonstrate that:
* **PackNet is highly effective** at preventing forgetting, likely through its mechanism of allocating separate network parameters for each task. Its flat line is the ideal outcome.
* **Regularization-based methods (EWC, SI, MAS, etc.)** offer some protection against forgetting compared to naive `finetuning`, but their effectiveness diminishes over long task sequences, as shown by their declining slopes. Their relative performance is sensitive to task ordering.
* **The gap between sequential methods and the `joint*` baseline** quantifies the "cost" of learning tasks one after another versus all at once. Closing this gap is the central goal of continual learning research.
* **Task relatedness matters:** The smoother curves in (a) and (b) suggest that when tasks are related, knowledge transfer might mitigate some forgetting, whereas unrelated tasks (c) cause more disruptive interference, leading to volatile performance.
The investigation reveals a clear hierarchy: specialized architectures like PackNet offer robust but potentially less scalable solutions, while regularization methods provide a more flexible but imperfect compromise. The persistent downward trend for most methods underscores that robust, general-purpose continual learning remains an open challenge.
DECODING INTELLIGENCE...