## Line Graphs: Accuracy Trends Across Task Sequences
### Overview
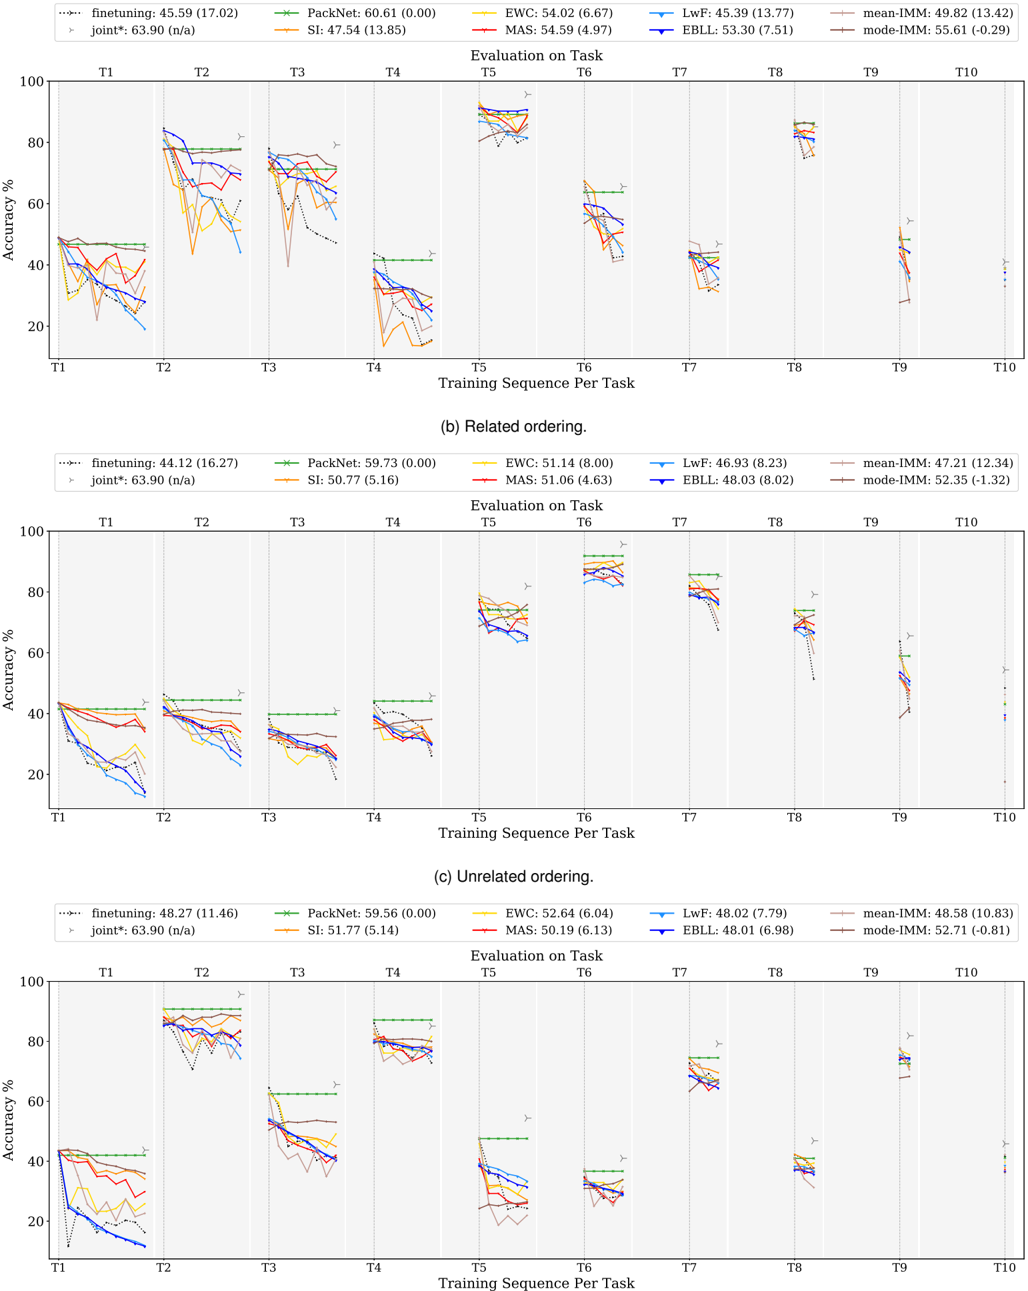
The image contains three line graphs comparing the accuracy performance of various machine learning methods across 10 sequential tasks (T1-T10). Two graphs show "Related ordering" task sequences, while one shows "Unrelated ordering". Each graph tracks accuracy (%) on the y-axis against training sequence per task on the x-axis.
### Components/Axes
- **X-axis**: "Training Sequence Per Task" (T1 to T10)
- **Y-axis**: "Accuracy %" (0-100 scale)
- **Legends**: Located at top of each graph, showing:
- Methods: finetuning, PackNet, EWC, LwF, MAS, IMBL, mean-IMM, mode-IMM
- Color-coded lines with performance metrics (e.g., "45.59 (17.02)")
- **Graph Titles**:
- (a) Related ordering
- (b) Related ordering
- (c) Unrelated ordering
### Detailed Analysis
#### Graph (a) Related ordering
- **Finetuning**: Starts at 45.59% (17.02) at T1, drops sharply to ~20% by T3, then fluctuates between 30-50%
- **PackNet**: Maintains ~60% accuracy throughout, with minor fluctuations
- **EWC**: Peaks at 54.02% (6.67) at T1, declines to ~40% by T5, then stabilizes
- **LwF**: Starts at 45.33% (13.77), drops to ~30% by T4, then recovers to ~45%
- **MAS**: Shows gradual decline from 54.59% (4.97) at T1 to ~40% by T10
- **IMBL**: Starts at 53.30% (7.51), declines to ~40% by T6, then stabilizes
- **mean-IMM**: Stable at ~49.82% (13.42) across all tasks
- **mode-IMM**: Stable at ~55.61% (-0.29) across all tasks
#### Graph (b) Related ordering
- **Finetuning**: Starts at 44.12% (16.27), drops to ~30% by T3, then fluctuates between 30-50%
- **PackNet**: Maintains ~59.73% (0.00) accuracy throughout
- **EWC**: Peaks at 51.14% (8.00) at T1, declines to ~40% by T5, then stabilizes
- **LwF**: Starts at 46.93% (8.23), drops to ~35% by T4, then recovers to ~45%
- **MAS**: Starts at 51.06% (4.63), declines to ~40% by T10
- **IMBL**: Starts at 48.03% (8.02), declines to ~40% by T6, then stabilizes
- **mean-IMM**: Stable at ~47.21% (12.34) across all tasks
- **mode-IMM**: Stable at ~52.35% (-1.32) across all tasks
#### Graph (c) Unrelated ordering
- **Finetuning**: Starts at 48.27% (11.46), drops to ~30% by T3, then fluctuates between 30-50%
- **PackNet**: Maintains ~59.56% (0.00) accuracy throughout
- **EWC**: Peaks at 52.64% (6.04) at T1, declines to ~40% by T5, then stabilizes
- **LwF**: Starts at 48.02% (7.79), drops to ~35% by T4, then recovers to ~45%
- **MAS**: Starts at 50.19% (6.13), declines to ~40% by T10
- **IMBL**: Starts at 48.01% (6.98), declines to ~40% by T6, then stabilizes
- **mean-IMM**: Stable at ~48.58% (10.83) across all tasks
- **mode-IMM**: Stable at ~52.71% (-0.81) across all tasks
### Key Observations
1. **Task Ordering Impact**:
- Related ordering (graphs a/b) shows more stable performance for most methods
- Unrelated ordering (graph c) introduces greater variability and lower baseline performance
2. **Method Performance**:
- **PackNet** consistently maintains highest accuracy across all scenarios
- **mode-IMM** shows most stable performance in related ordering
- **Finetuning** exhibits largest performance drops in unrelated ordering
- **mean-IMM** demonstrates consistent mid-range performance across all scenarios
3. **Uncertainty Patterns**:
- Methods with lower standard deviations (e.g., PackNet's 0.00) show more stable performance
- Finetuning consistently has highest uncertainty (16-17 range)
### Interpretation
The data demonstrates that task sequence ordering significantly impacts model performance. Related task sequences allow models to better leverage prior knowledge, resulting in more stable accuracy trends. Unrelated ordering introduces catastrophic interference, causing performance drops across most methods.
Notably, **PackNet**'s consistent performance suggests effective catastrophic forgetting mitigation. The **mode-IMM** method shows particular promise in related ordering scenarios, maintaining near-peak performance throughout. The stability of **mean-IMM** across all scenarios indicates robustness to task ordering changes.
The performance metrics in parentheses (likely mean ± standard deviation) reveal that methods with lower uncertainty (smaller numbers) generally maintain more consistent performance, while higher uncertainty values (e.g., finetuning's 16-17 range) correlate with greater performance variability.