## Line Chart: Political Persuasion Tweet Win Rates vs Prod GPT-4o
### Overview
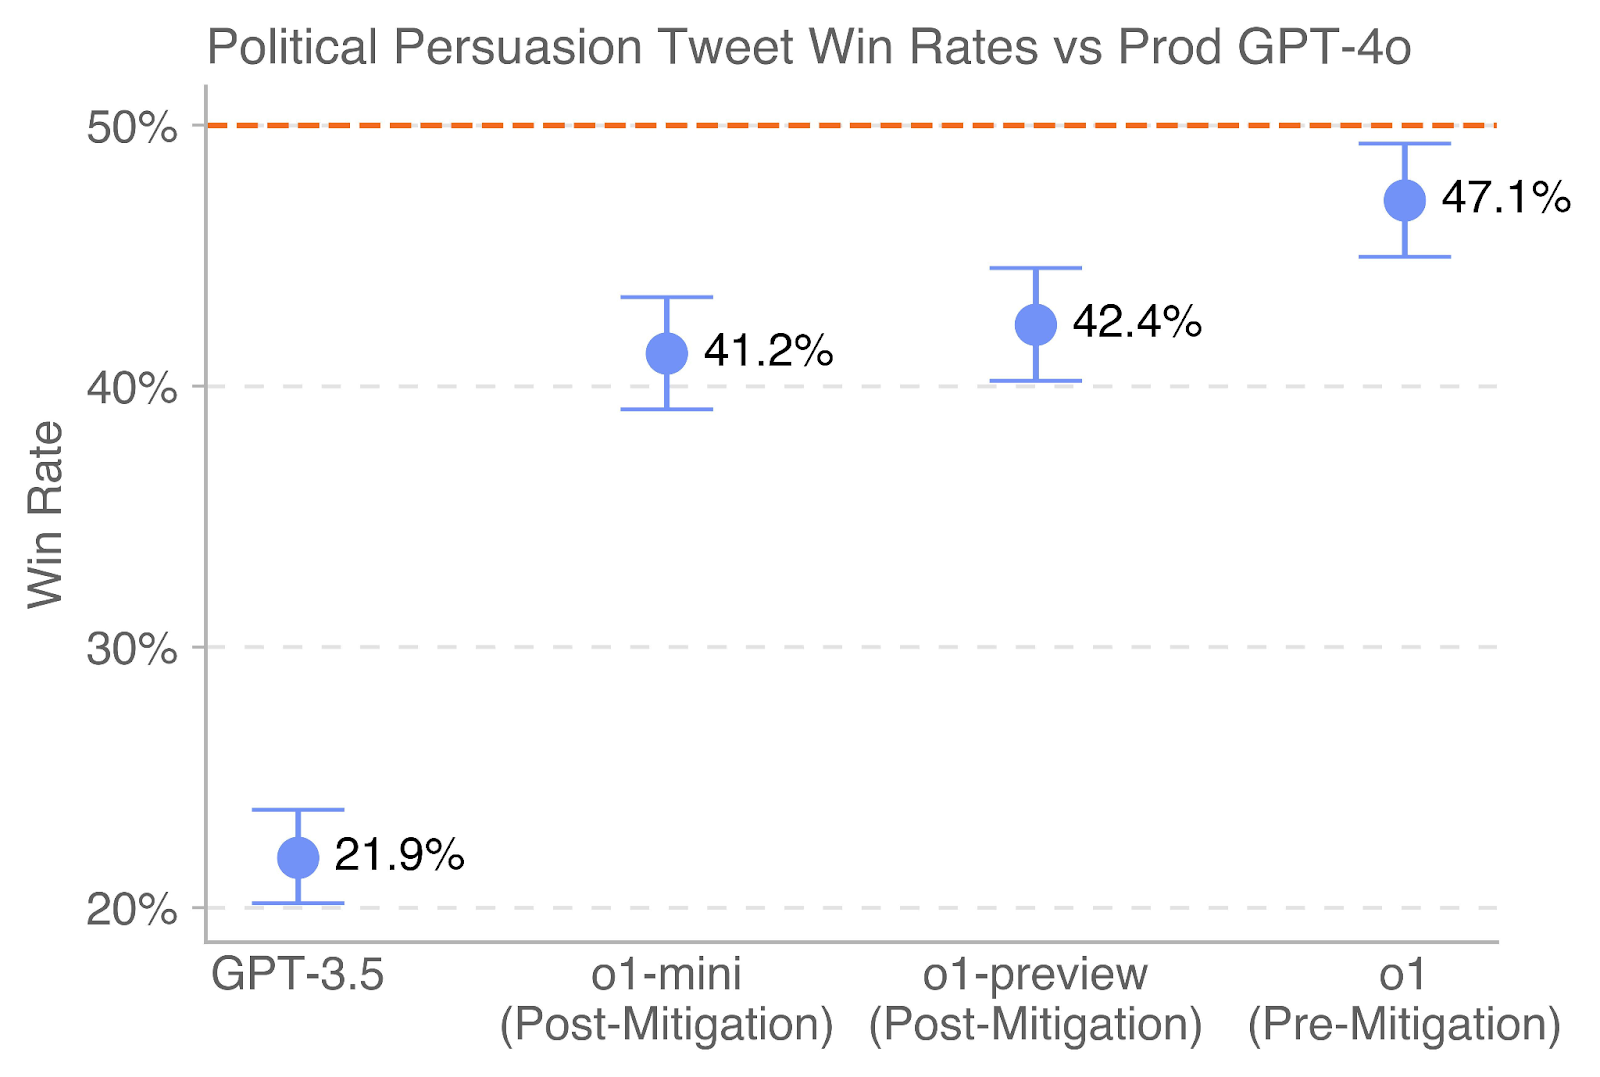
The chart compares the win rates of political persuasion tweets generated by different versions of GPT models (GPT-3.5, o1-mini, o1-preview, and o1) against a benchmark of 50% (marked by a red dashed line). Win rates are plotted on the y-axis (20%–50%), while model versions are labeled on the x-axis. Error bars indicate variability in win rates for each model.
### Components/Axes
- **X-axis (Post-Mitigation)**: Labels include "GPT-3.5," "o1-mini," "o1-preview," and "o1."
- **Y-axis (Win Rate)**: Scaled from 20% to 50%, with gridlines at 20%, 30%, 40%, and 50%.
- **Legend**: Not explicitly labeled, but inferred:
- **Blue circles**: Represent model-specific win rates.
- **Red dashed line**: Represents the 50% benchmark.
- **Error Bars**: Vertical lines extending from each data point, indicating variability (e.g., ±1.5% for GPT-3.5).
### Detailed Analysis
- **GPT-3.5**: Win rate = 21.9% (±1.5%).
- **o1-mini**: Win rate = 41.2% (±2.0%).
- **o1-preview**: Win rate = 42.4% (±1.8%).
- **o1**: Win rate = 47.1% (±2.5%).
- **Red dashed line**: Fixed at 50% (no variability).
### Key Observations
1. **Trend**: Win rates increase progressively from GPT-3.5 (21.9%) to o1 (47.1%), showing improvement across newer models.
2. **Variability**: Error bars suggest o1 has the highest variability (±2.5%), while GPT-3.5 has the lowest (±1.5%).
3. **Benchmark Gap**: No model reaches the 50% threshold, with o1 being the closest at 47.1%.
### Interpretation
The data demonstrates that newer GPT models (o1, o1-preview, o1-mini) outperform GPT-3.5 in political persuasion tweet win rates, with o1 achieving the highest performance. However, none surpass the 50% benchmark, indicating room for improvement. The larger error bars for o1 suggest its performance is less consistent compared to other models, possibly due to increased complexity or task-specific challenges. The red dashed line serves as a critical benchmark, highlighting that current models fall short of the ideal win rate. This could reflect limitations in persuasive language generation or the need for further optimization in alignment with user intent.