\n
## Chart: Political Persuasion Tweet Win Rates vs Prod GPT-4o
### Overview
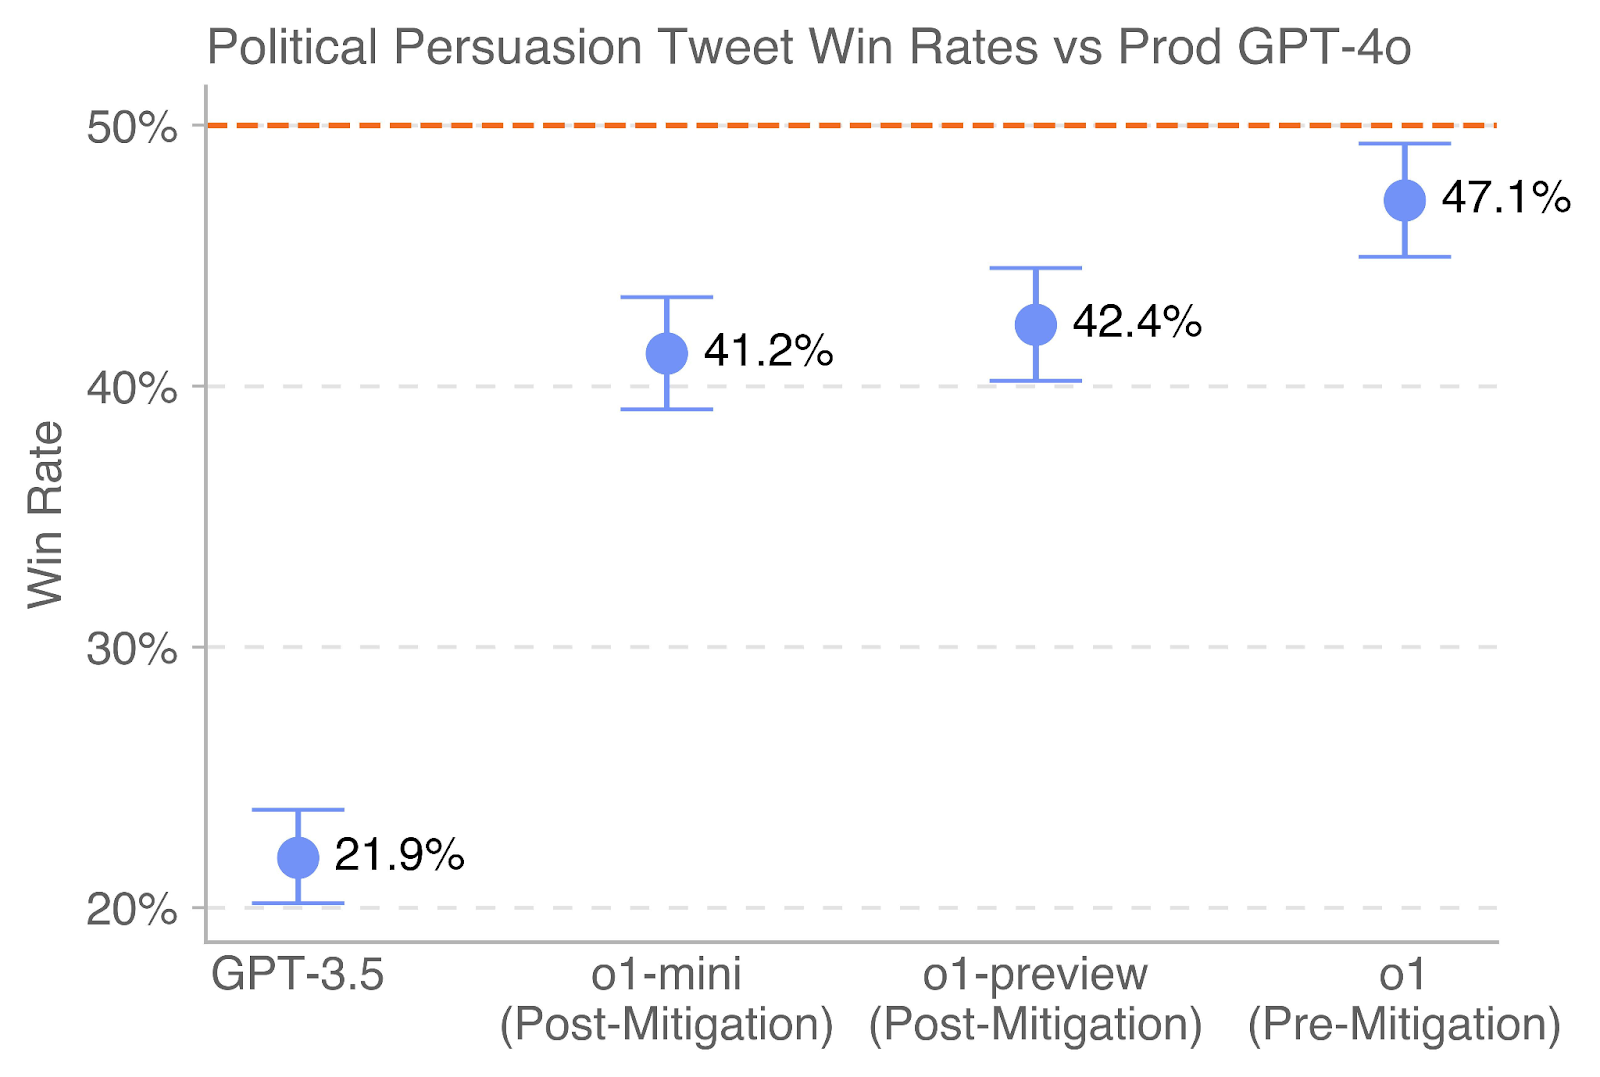
This chart displays the "Win Rate" of political persuasion tweets generated by different GPT models (GPT-3.5, o1-mini, o1-preview, and o1) compared to the Prod GPT-4o model. Each data point represents the average win rate, with error bars indicating the uncertainty around that average. The chart aims to compare the effectiveness of different models in generating persuasive political tweets.
### Components/Axes
* **Title:** "Political Persuasion Tweet Win Rates vs Prod GPT-4o" (Top-center)
* **X-axis:** Model Name (GPT-3.5, o1-mini (Post-Mitigation), o1-preview (Post-Mitigation), o1 (Pre-Mitigation)). Labels are horizontally aligned.
* **Y-axis:** "Win Rate" (Vertical, left side). Scale ranges from 20% to 50% with increments of 10%.
* **Data Points:** Blue circles representing the average win rate for each model.
* **Error Bars:** Vertical lines extending above and below each data point, indicating the uncertainty range.
* **Horizontal Line:** Dashed horizontal line at 50% (Top of chart).
### Detailed Analysis
The chart presents four data series, each corresponding to a different GPT model. The data points are plotted with error bars.
* **GPT-3.5:** The win rate is approximately 21.9% ± (error bar extends from roughly 18% to 26%). The line slopes upward.
* **o1-mini (Post-Mitigation):** The win rate is approximately 41.2% ± (error bar extends from roughly 38% to 44%). The line slopes upward.
* **o1-preview (Post-Mitigation):** The win rate is approximately 42.4% ± (error bar extends from roughly 39% to 45%). The line slopes upward.
* **o1 (Pre-Mitigation):** The win rate is approximately 47.1% ± (error bar extends from roughly 44% to 50%). The line slopes upward.
### Key Observations
* GPT-3.5 has a significantly lower win rate compared to the other models.
* The win rates for o1-mini, o1-preview, and o1 are relatively close to each other, all falling between 41% and 47%.
* The o1 (Pre-Mitigation) model has the highest win rate among the tested models.
* The error bars suggest a reasonable degree of uncertainty around each win rate estimate.
### Interpretation
The data suggests that the GPT-4o model (implied benchmark) is performing better than GPT-3.5 in generating persuasive political tweets. The o1 models, particularly the pre-mitigation version, show win rates approaching that of GPT-4o. The "Post-Mitigation" labels indicate that some adjustments were made to the o1-mini and o1-preview models, potentially to address biases or improve safety, which may have slightly reduced their win rates. The fact that the pre-mitigation version of o1 has the highest win rate suggests that the mitigation strategies may have had a trade-off with persuasiveness. The chart highlights the importance of model selection and potential trade-offs between performance and ethical considerations in the context of political persuasion. The error bars indicate that the differences between the o1 models are not statistically significant.