## Chart: Political Persuasion Tweet Win Rates vs Prod GPT-4o
### Overview
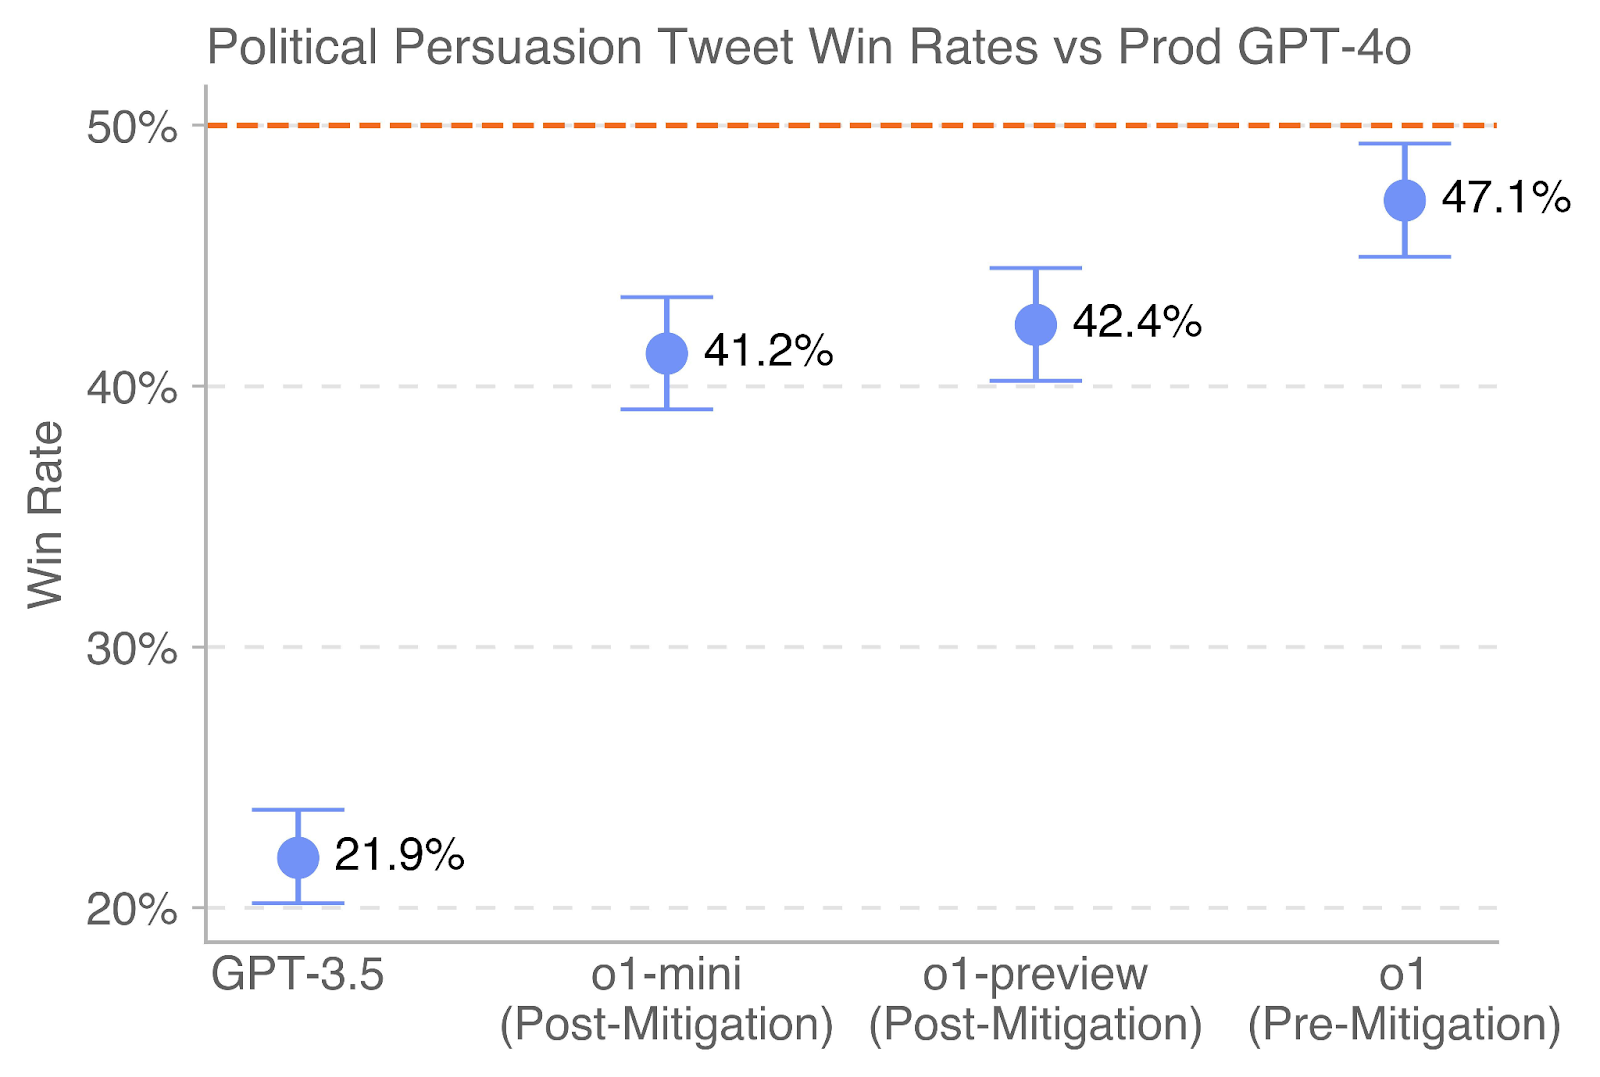
This is a dot plot with error bars comparing the "Win Rate" of four different AI models on a task related to political persuasion tweets. The performance is benchmarked against a baseline represented by "Prod GPT-4o". The chart displays a clear upward trend in win rates from the oldest model (GPT-3.5) to the newest (o1).
### Components/Axes
* **Chart Title:** "Political Persuasion Tweet Win Rates vs Prod GPT-4o"
* **Y-Axis:**
* **Label:** "Win Rate"
* **Scale:** Percentage, ranging from 20% to 50%.
* **Major Ticks/Gridlines:** At 20%, 30%, 40%, and 50%. The gridlines are dashed and light gray.
* **X-Axis:**
* **Categories (from left to right):**
1. "GPT-3.5"
2. "o1-mini (Post-Mitigation)"
3. "o1-preview (Post-Mitigation)"
4. "o1 (Pre-Mitigation)"
* **Baseline:** A dashed orange line runs horizontally across the chart at the 50% mark. This represents the performance of "Prod GPT-4o", which serves as the comparison benchmark.
* **Data Series:** Four data points, each represented by a blue dot with vertical error bars (whiskers). Each dot is labeled with its exact percentage value.
### Detailed Analysis
The chart presents the following specific data points, listed from left to right:
1. **GPT-3.5**
* **Win Rate:** 21.9%
* **Error Bar Range (Approximate):** The lower whisker is at ~20.0%, and the upper whisker is at ~23.8%. This indicates the lowest performance and a moderate degree of uncertainty.
2. **o1-mini (Post-Mitigation)**
* **Win Rate:** 41.2%
* **Error Bar Range (Approximate):** The lower whisker is at ~39.0%, and the upper whisker is at ~43.4%. This shows a significant performance jump from GPT-3.5.
3. **o1-preview (Post-Mitigation)**
* **Win Rate:** 42.4%
* **Error Bar Range (Approximate):** The lower whisker is at ~40.0%, and the upper whisker is at ~44.8%. This is a slight improvement over o1-mini, and its error bar overlaps with that of o1-mini.
4. **o1 (Pre-Mitigation)**
* **Win Rate:** 47.1%
* **Error Bar Range (Approximate):** The lower whisker is at ~45.0%, and the upper whisker is at ~49.2%. This is the highest-performing model shown, with the smallest error bar range, suggesting more consistent results.
**Trend Verification:** The visual trend is a clear, monotonic upward slope from left to right. The blue dot for each subsequent model is positioned higher on the Y-axis than the previous one, confirming the increasing win rate values.
### Key Observations
* **Performance Hierarchy:** There is a strict performance hierarchy: GPT-3.5 << o1-mini < o1-preview < o1.
* **Proximity to Baseline:** The "o1 (Pre-Mitigation)" model's win rate (47.1%) and the top of its error bar (~49.2%) approach but do not reach the 50% Prod GPT-4o baseline.
* **Impact of Mitigation:** The two "Post-Mitigation" models (o1-mini and o1-preview) perform significantly better than GPT-3.5 but worse than the "Pre-Mitigation" o1 model. This suggests the mitigation process, while likely improving safety or alignment, may have reduced raw persuasive performance on this specific task.
* **Error Bar Overlap:** The error bars for "o1-mini" and "o1-preview" overlap, indicating that the difference in their win rates (41.2% vs. 42.4%) may not be statistically significant based on this visualization alone.
### Interpretation
This chart demonstrates the evolution of a specific capability—political persuasion in tweet generation—across successive AI model generations. The data suggests that:
1. **Capability Advancement:** Newer model architectures (the o1 series) possess a substantially higher baseline capability for this task compared to the older GPT-3.5, nearly doubling the win rate.
2. **Trade-offs with Safety:** The lower performance of the "Post-Mitigation" models compared to the "Pre-Mitigation" o1 model implies a potential trade-off. Techniques used to mitigate risks (e.g., reducing harmful outputs, increasing neutrality) may also dampen the model's effectiveness in a persuasive context. This highlights a core challenge in AI alignment: enhancing safety without unduly limiting beneficial capabilities.
3. **Benchmark Gap:** Even the most capable model shown (o1) does not surpass the Prod GPT-4o baseline in this evaluation. This indicates that Prod GPT-4o either represents a more advanced state of this specific capability or was evaluated under different conditions. The chart frames "Prod GPT-4o" as the current state-of-the-art target to beat.
4. **Investigative Lens (Peircean):** The chart is an *index* of model development progress (showing a direct correlation between model iteration and performance) and a *symbol* of the ongoing tension between capability and safety in AI. The missing piece is the *iconic* representation of what "political persuasion" entails in the test—without knowing the exact methodology, we can only infer the models are being judged on their ability to generate convincing political content.