## Flowchart: SymDQN Decision Process
### Overview
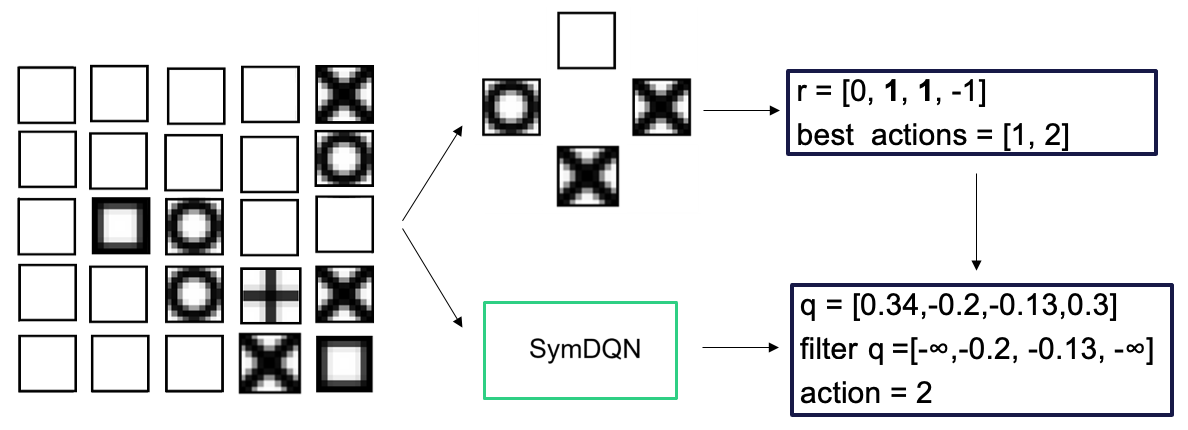
The image depicts a flowchart illustrating a decision-making process using a SymDQN (Symmetric Deep Q-Network) model. The process begins with a 5x5 grid of symbols, transitions through a central "SymDQN" component, and outputs decision metrics (r, best actions, q-values) leading to a final action selection.
### Components/Axes
1. **Left Grid**:
- 5x5 matrix of cells containing symbols:
- Empty squares (white)
- Black squares with white centers
- Black squares with white circles
- Black squares with white Xs
- Black squares with white plus signs
- No explicit axis labels or legends, but symbols are spatially arranged in a grid.
2. **Central SymDQN Box**:
- Labeled "SymDQN" in bold text.
- Connected via bidirectional arrows to the grid and decision outputs.
3. **Decision Outputs**:
- **Top Right Box**:
- Label: `r = [0, 1, 1, -1]`
- Label: `best actions = [1, 2]`
- **Bottom Right Box**:
- Label: `q = [0.34, -0.2, -0.13, 0.3]`
- Label: `filter q = [-∞, -0.2, -0.13, -∞]`
- Label: `action = 2`
### Detailed Analysis
1. **Grid Symbols**:
- Symbols likely represent states or positions in a game/environment (e.g., Tic-Tac-Toe variants).
- Example: The bottom-right cell contains a black square with a white X, while the center cell has a black square with a white plus sign.
2. **Flow**:
- Arrows indicate a left-to-right flow:
- Grid → SymDQN → Decision outputs (r, best actions, q-values).
- SymDQN processes the grid state to compute rewards (`r`) and candidate actions (`best actions`).
- Q-values (`q`) are filtered to select the final action (`action = 2`).
3. **Numerical Values**:
- `r = [0, 1, 1, -1]`: Reward values for candidate actions.
- `best actions = [1, 2]`: Indices of actions with highest rewards.
- `q = [0.34, -0.2, -0.13, 0.3]`: Q-values for all actions.
- Filtered `q = [-∞, -0.2, -0.13, -∞]`: Discards actions with negative infinity Q-values, leaving indices 1 and 2.
- Final `action = 2`: Selected action after filtering.
### Key Observations
- The SymDQN evaluates multiple actions (indices 1 and 2) but selects action 2 after filtering Q-values.
- Negative infinity (`-∞`) in filtered Q-values suggests penalties for invalid or suboptimal actions.
- The grid's symbols may encode environmental states influencing the decision process.
### Interpretation
The flowchart demonstrates a reinforcement learning workflow where SymDQN:
1. **State Evaluation**: Analyzes the grid's symbolic state to identify viable actions.
2. **Reward Calculation**: Computes immediate rewards (`r`) for candidate actions.
3. **Q-Value Optimization**: Uses Q-values to prioritize actions, filtering out those with negligible or negative utility.
4. **Action Selection**: Chooses the optimal action (2) based on filtered Q-values, balancing exploration and exploitation.
This process highlights how SymDQN integrates symbolic state representation with numerical optimization to make decisions in structured environments.