# Technical Document Extraction: Expert Configuration Performance Analysis
## Chart Description
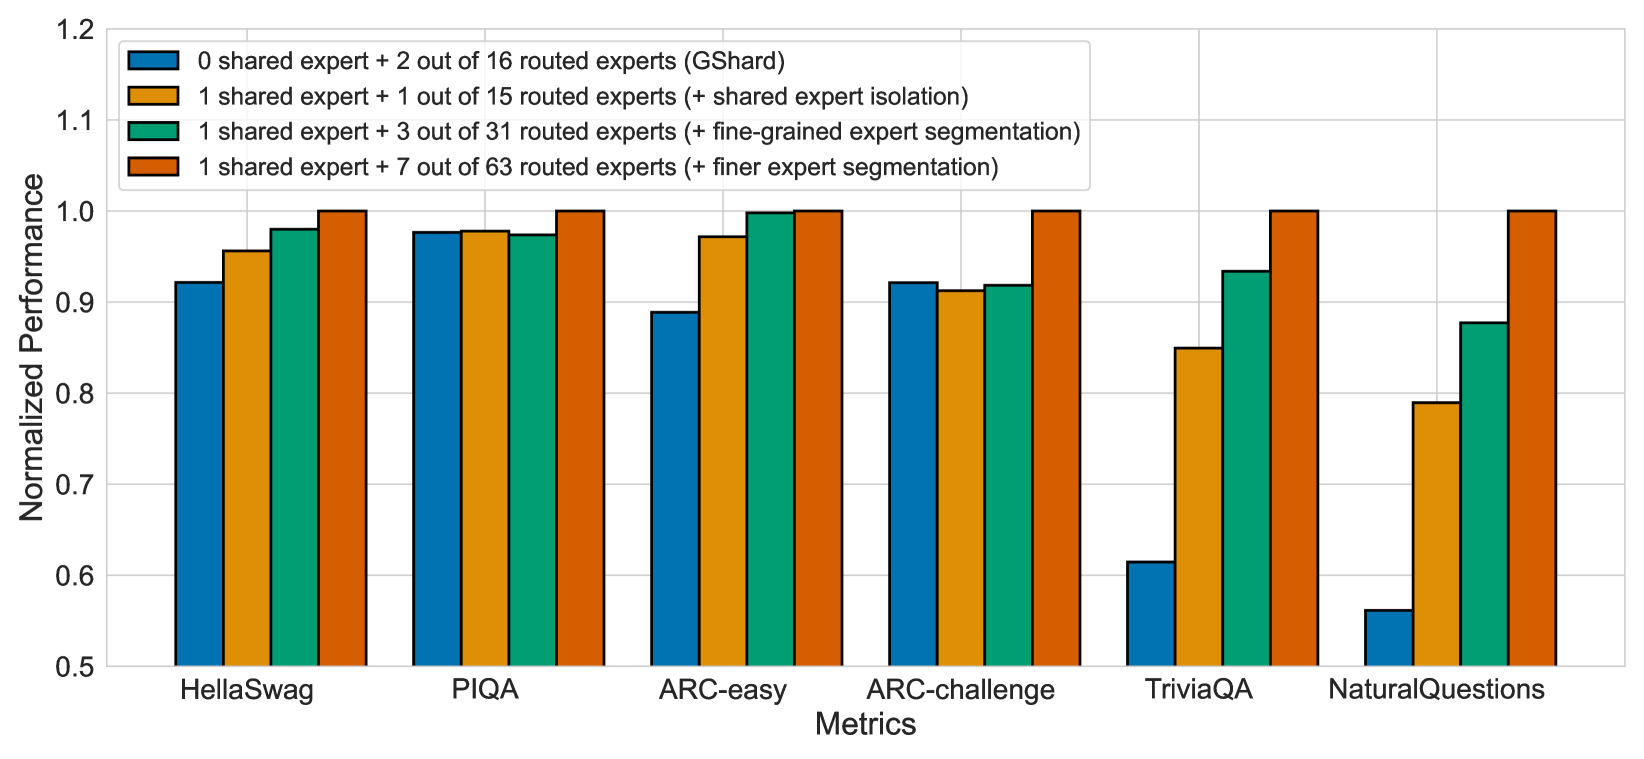
This bar chart compares the normalized performance of four expert configurations across six question-answering metrics. The configurations vary in the number of shared experts and routed experts, with increasing granularity in expert segmentation.
### Axis Labels
- **X-axis (Metrics):**
- HellaSwag
- PIQA
- ARC-easy
- ARC-challenge
- TriviaQA
- NaturalQuestions
- **Y-axis (Normalized Performance):**
- Scale: 0.5 to 1.2
- Increment: 0.1
### Legend
Four expert configurations with color-coded bars:
1. **Blue:** 0 shared expert + 2 out of 16 routed experts (GShard)
2. **Orange:** 1 shared expert + 15 routed experts (+ shared expert isolation)
3. **Green:** 1 shared expert + 31 routed experts (+ fine-grained expert segmentation)
4. **Red:** 1 shared expert + 63 routed experts (+ finer expert segmentation)
## Key Data Points & Trends
### Performance by Metric
| Metric | GShard (Blue) | Shared +15 (Orange) | Shared +31 (Green) | Shared +63 (Red) |
|---------------|---------------|---------------------|--------------------|------------------|
| HellaSwag | ~0.92 | ~0.95 | ~0.98 | ~1.00 |
| PIQA | ~0.98 | ~0.98 | ~0.97 | ~1.00 |
| ARC-easy | ~0.89 | ~0.96 | ~1.00 | ~1.00 |
| ARC-challenge | ~0.92 | ~0.91 | ~0.92 | ~1.00 |
| TriviaQA | ~0.61 | ~0.85 | ~0.94 | ~1.00 |
| NaturalQuestions | ~0.56 | ~0.79 | ~0.88 | ~1.00 |
### Observations
- **Performance Scaling:** All configurations achieve near-perfect performance (1.00) on most metrics when using 1 shared expert with 63 routed experts (red bars).
- **GShard Limitations:** The baseline GShard configuration (0 shared experts) shows significantly lower performance across all metrics, particularly on TriviaQA and NaturalQuestions.
- **Expert Segmentation Impact:** Increasing the number of routed experts (from 15 to 63) improves performance in configurations with 1 shared expert, with the most notable gains in TriviaQA and NaturalQuestions.
- **Consistency:** The 1 shared expert + 63 routed experts configuration (red) consistently outperforms other configurations across all metrics.
## Technical Notes
- Normalized performance values suggest relative comparison rather than absolute scores.
- The chart implies a trade-off between expert sharing and segmentation granularity, with finer segmentation (63 experts) yielding optimal results.
- No configuration exceeds the 1.00 performance threshold except in specific cases (e.g., PIQA with 1 shared +15 experts).