\n
## Diagram: Program Fragment and Traces with Symbolic Planner
### Overview
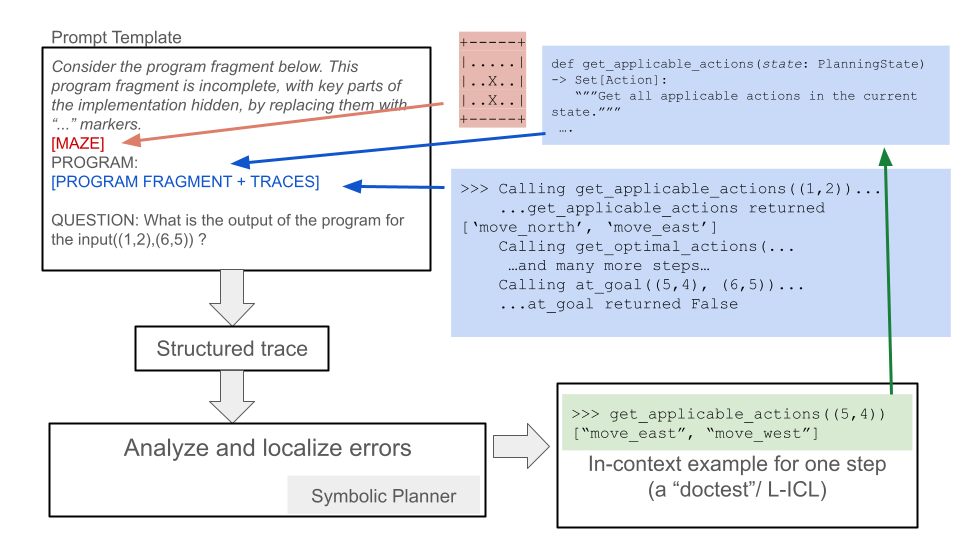
The image presents a diagram illustrating a process involving a program fragment, traces, a symbolic planner, and error analysis. It depicts a flow of information from a prompt template through a program fragment and traces to a symbolic planner, ultimately leading to error localization. The diagram uses arrows to indicate the direction of information flow and boxes to represent different stages or components.
### Components/Axes
The diagram consists of the following components:
* **Prompt Template:** A rectangular box on the left side labeled "Prompt Template". It contains text describing the context of the program fragment and traces.
* **Program Fragment + Traces:** A larger rectangular box connected to the "Prompt Template" via blue arrows. It is labeled "[MAZE] PROGRAM: [PROGRAM FRAGMENT + TRACES]".
* **Question:** A text block within the "Program Fragment + Traces" box, asking "What is the output of the program for the input(1,2,(6,5))?".
* **Structured Trace:** A rectangular box connected to the "Program Fragment + Traces" box via a gray arrow. It is labeled "Structured trace".
* **Symbolic Planner:** A rectangular box connected to the "Structured trace" box via a gray arrow. It is labeled "Symbolic Planner".
* **Analyze and localize errors:** A rectangular box connected to the "Symbolic Planner" box via a gray arrow. It is labeled "Analyze and localize errors".
* **Code Snippet (Python):** A rectangular box on the right side containing Python code. It defines a function `get_applicable_actions`.
* **Trace Output 1:** A text block below the code snippet showing the output of calling `get_applicable_actions(1,2)` which returns `['move north', 'move east']`.
* **Trace Output 2:** A text block below the first trace output showing the output of calling `get_optimal_actions` and `at_goal`.
* **Trace Output 3:** A green rectangular box containing the output of `get_applicable_actions(5,4)` which returns `["move_east", "move_west"]`. It is labeled "In-context example for one step (a “doctest”/ L-ICL)".
### Detailed Analysis or Content Details
The Python code snippet defines a function `get_applicable_actions` that takes a `state` (of type `PlanningState`) as input. The function is documented with a docstring: `"""Get all applicable actions in the current state."""`. The code is incomplete, indicated by "...".
The first trace output shows that calling `get_applicable_actions(1,2)` returns a list of two strings: `'move north'` and `'move east'`.
The second trace output shows a series of calls to `get_optimal_actions` and `at_goal` with the inputs `(5,4)` and `(6,5)`. The output of `at_goal` is `False`.
The third trace output shows that calling `get_applicable_actions(5,4)` returns a list of two strings: `"move_east"` and `"move_west"`.
The arrows indicate the following flow:
1. The "Prompt Template" feeds into the "Program Fragment + Traces".
2. The "Program Fragment + Traces" generates a "Structured trace".
3. The "Structured trace" is processed by the "Symbolic Planner".
4. The "Symbolic Planner" is used to "Analyze and localize errors".
5. The code snippet and trace outputs provide examples of the program's behavior.
### Key Observations
The diagram illustrates a debugging or verification process for a planning algorithm. The "Symbolic Planner" appears to be used to analyze the program's behavior based on the traces. The "In-context example" suggests a form of learning or demonstration. The incomplete code snippet indicates that the program is not fully defined.
### Interpretation
The diagram demonstrates a workflow for debugging or verifying a planning algorithm. The process starts with a prompt template that defines the problem. The program fragment and traces provide concrete examples of the algorithm's behavior. The symbolic planner analyzes these traces to identify errors or inconsistencies. The "In-context example" suggests that the symbolic planner may be using a form of learning or demonstration to improve its performance. The diagram highlights the importance of traces in debugging and verifying planning algorithms. The incomplete code snippet suggests that the algorithm is still under development. The diagram is a high-level overview of the process and does not provide specific details about the implementation of the symbolic planner or the error analysis techniques used. The diagram is a conceptual illustration rather than a precise technical specification.