TECHNICAL ASSET FINGERPRINT
7dfb11b8eb1654304c8ee318
Click to view fullscreen
Press ESC or click to close
FOUND IN PAPERS
EXPERT: healer-alpha-free VERSION 1
RUNTIME: free/openrouter/healer-alpha
INTEL_VERIFIED
## Diagram: Program Trace Analysis and Error Localization Workflow
### Overview
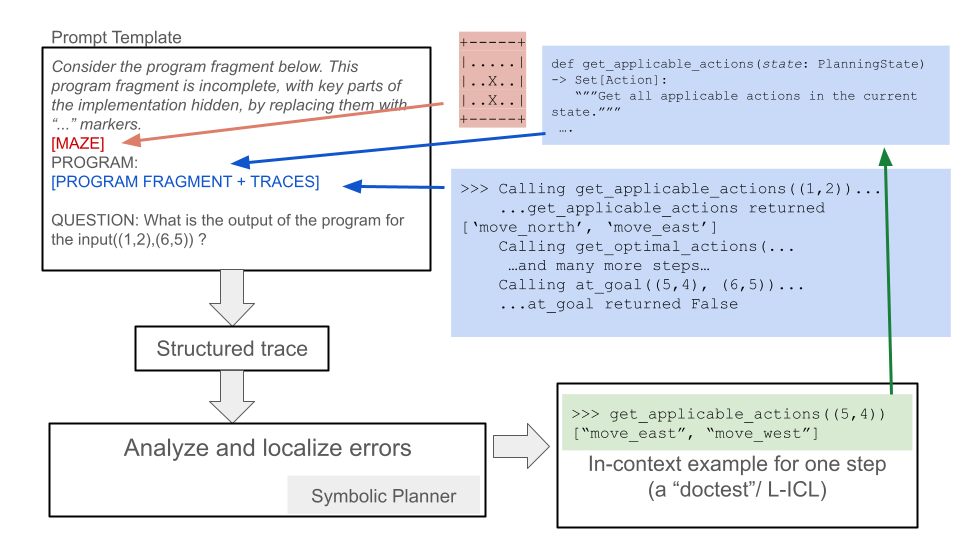
The image is a technical flowchart illustrating a process for analyzing program execution traces to localize errors, likely within the context of automated planning or AI reasoning systems. It depicts a pipeline that starts with a prompt containing an incomplete program and execution traces, processes this through structured analysis, and uses symbolic planning and in-context learning examples to understand and debug the program's behavior.
### Components/Axes
The diagram is composed of several text boxes connected by directional arrows, indicating data flow and process steps. There are no traditional chart axes. The components are spatially arranged as follows:
1. **Top-Left (Prompt Template Box):** A large rectangular box containing the initial input.
2. **Top-Right (Code Snippets):** Two blue-shaded boxes containing Python-like code and execution traces.
3. **Center-Left (Process Flow):** A vertical sequence of three boxes connected by downward arrows.
4. **Bottom-Right (Example Box):** A green-shaded box containing a code example.
5. **Connecting Arrows:** Colored arrows (red, blue, green) show relationships and data flow between components.
### Detailed Analysis
**1. Prompt Template Box (Top-Left):**
* **Title:** `Prompt Template`
* **Content:**
* `Consider the program fragment below. This program fragment is incomplete, with key parts of the implementation hidden, by replacing them with "..." markers.`
* `[MAZE]` (This text is in red, with a red arrow pointing from it to a small grid diagram).
* `PROGRAM:`
* `[PROGRAM FRAGMENT + TRACES]` (This text is in blue, with a blue arrow pointing from it to the code snippets on the right).
* `QUESTION: What is the output of the program for the input((1,2),(6,5)) ?`
**2. Maze Diagram (Top-Center):**
* A small 5x5 grid representing a maze.
* The grid contains symbols: `.` (empty/path), `X` (wall/obstacle).
* The visible rows are:
* Row 1: `...X.`
* Row 2: `..X..`
* Row 3: `..X..`
* (Rows 4 and 5 are partially obscured but follow a similar pattern).
* A **red arrow** originates from the `[MAZE]` label in the Prompt Template and points to this grid.
**3. Code Snippets (Top-Right, Blue Boxes):**
* **Upper Blue Box:**
* Contains a Python function definition:
```python
def get_applicable_actions(state: PlanningState) -> Set[Action]:
"""Get all applicable actions in the current state."""
...
```
* **Lower Blue Box:**
* Contains a sample execution trace (likely a "doctest" or interactive Python session):
```
>>> Calling get_applicable_actions((1,2))...
...get_applicable_actions returned ['move_north', 'move_east']
>>> Calling get_optimal_actions(...)
...and many more steps...
>>> Calling at_goal((5,4), (6,5))...
...at_goal returned False
```
* A **blue arrow** originates from the `[PROGRAM FRAGMENT + TRACES]` label in the Prompt Template and points to these code snippets.
**4. Process Flow (Center-Left):**
* **Box 1 (Top):** `Structured trace` (Receives input from the Prompt Template via a downward arrow).
* **Box 2 (Middle):** `Analyze and localize errors` (Receives input from "Structured trace").
* **Box 3 (Bottom):** `Symbolic Planner` (This text is right-aligned within the box. Receives input from "Analyze and localize errors").
* A **gray arrow** points from the "Analyze and localize errors" box to the right, towards the Example Box.
**5. Example Box (Bottom-Right, Green Box):**
* Contains a code example, formatted as a doctest:
```
>>> get_applicable_actions((5,4))
["move_east", "move_west"]
```
* Below the code: `In-context example for one step (a "doctest"/ L-ICL)`
* A **green arrow** originates from this box and points upward to the `get_applicable_actions` function definition in the upper blue code snippet box.
### Key Observations
* **Color-Coded Flow:** The diagram uses color strategically. Red links the abstract maze problem to its representation. Blue links the program fragment placeholder to its concrete code and trace examples. Green links a specific in-context learning (ICL) example back to the function it exemplifies.
* **Process Pipeline:** The core workflow is linear: Prompt -> Structured Trace -> Error Analysis -> Symbolic Planner.
* **In-Context Learning (ICL) Integration:** The green box and arrow explicitly show how a "doctest" example is provided as an in-context learning signal to the system, presumably to help the Symbolic Planner understand the function's behavior.
* **Problem Context:** The input question `((1,2),(6,5))` and the maze grid suggest the program is related to pathfinding or navigation in a grid world. The function names `get_applicable_actions`, `get_optimal_actions`, and `at_goal` reinforce this.
### Interpretation
This diagram outlines a methodology for **debugging or understanding incomplete program specifications through execution traces and symbolic reasoning**. The process appears to be:
1. **Problem Framing:** A high-level problem (navigate a maze from start (1,2) to goal (6,5)) is presented alongside an incomplete program implementation.
2. **Trace Generation:** The system executes the available program fragments, generating a "structured trace" of function calls and returns (e.g., what actions are available at state (1,2)).
3. **Analysis & Localization:** The trace is analyzed to find discrepancies or errors. The goal is to "localize" where the program's behavior deviates from the expected logic required to solve the maze.
4. **Symbolic Planning & ICL:** A "Symbolic Planner" component is invoked. Crucially, it is provided with **in-context examples** (the green "doctest" box). These examples, like showing that `get_applicable_actions((5,4))` returns `["move_east", "move_west"]`, serve as concrete demonstrations of the intended function behavior. This allows the planner to reason symbolically about the program's logic, fill in the "..." gaps, and ultimately answer the output question.
The underlying concept is a form of **program synthesis or repair via trace analysis and few-shot learning**. Instead of just reading code, the system learns from its dynamic execution behavior (traces) and a few correct examples (ICL) to infer the complete program logic. This is a powerful approach for debugging complex systems where the specification is implicit in the desired input-output behavior and example executions.
DECODING INTELLIGENCE...