## Flowchart: Program Analysis Process
### Overview
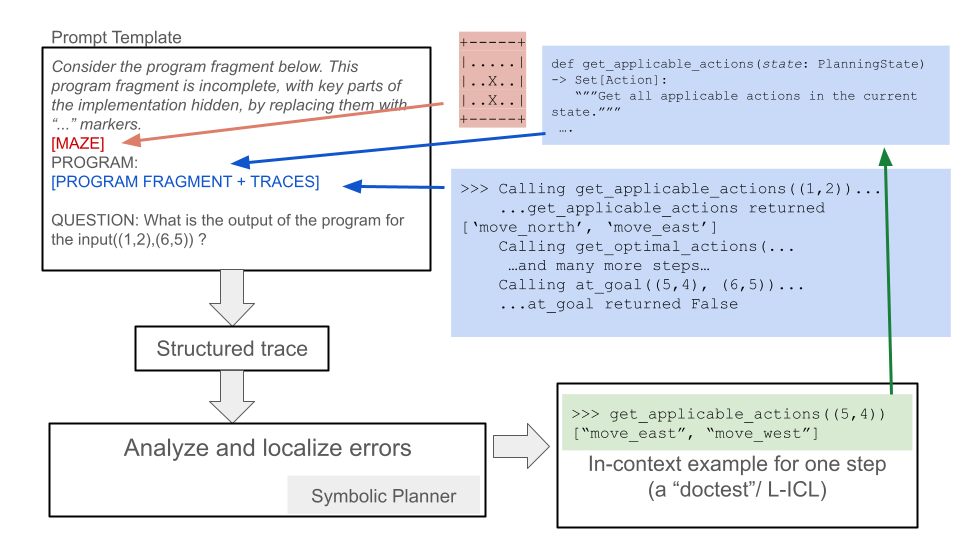
This flowchart illustrates a structured approach to analyzing a program fragment with hidden implementation details. It outlines a workflow from problem definition to error localization, using color-coded elements and code examples to demonstrate key steps.
### Components/Axes
- **Main Flow**: Left-to-right progression through analysis stages
- **Color Coding**:
- Red: Placeholders/MAZE elements
- Blue: Program structure/code
- Green: Execution example
- **Key Elements**:
1. Prompt Template (top-left)
2. Code snippets with comments
3. Structured trace box
4. Error analysis box
5. In-context example box
### Detailed Analysis
#### Prompt Template Section
- Contains a program fragment with hidden implementation marked by "..." placeholders
- Includes a question about program output for input (1,2),(6,5)
- Red arrow labeled "MAZE" points to placeholder markers
#### Code Snippet Section
- Blue box shows Python-like code with:
- Function definition: `def get_applicable_actions(state: PlanningState)`
- Action retrieval: `Set(Action): "Get all applicable actions in the current state."`
- Example execution: `get_applicable_actions((1,2))` returning `['move_north', 'move_east']`
#### Structured Trace
- Connects prompt to analysis stages via downward arrows
- Represents transformation of input into executable trace
#### Error Analysis
- Contains "Symbolic Planner" label in gray box
- Represents error localization component
#### In-Context Example
- Green box shows execution step:
- `get_applicable_actions((5,4))` returning `['move_east', 'move_west']`
- Demonstrates single-step execution (L-ICL)
### Key Observations
1. Color-coded elements create visual hierarchy:
- Red for missing implementation
- Blue for program structure
- Green for execution example
2. Arrows show directional flow:
- Red → Blue (problem definition to code)
- Blue → Green (code to execution)
3. Placeholders indicate incomplete implementation
4. Example demonstrates concrete code execution
### Interpretation
This diagram represents a systematic debugging/analysis framework where:
1. Program fragments with hidden logic are first defined
2. Structured traces map input to execution paths
3. Errors are localized through symbolic planning
4. Concrete examples demonstrate single-step execution
The color coding suggests a pedagogical approach to teaching program analysis, where students first identify missing implementation (red), then map program structure (blue), before executing and analyzing results (green). The example shows how the system would handle specific input coordinates through action retrieval and goal evaluation.