## Line Chart: Exact Match vs. Data Percentage for k=1 and k=2
### Overview
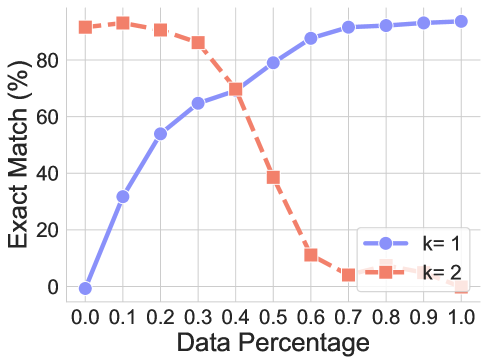
The image is a line chart comparing the "Exact Match (%)" against "Data Percentage" for two different parameters, k=1 and k=2. The chart shows how the exact match percentage changes as the data percentage increases for each parameter.
### Components/Axes
* **Y-axis (Vertical):** "Exact Match (%)". Scale ranges from 0 to 80, with implicit ticks at 20, 40, and 60.
* **X-axis (Horizontal):** "Data Percentage". Scale ranges from 0.0 to 1.0, with ticks at intervals of 0.1 (0.0, 0.1, 0.2, 0.3, 0.4, 0.5, 0.6, 0.7, 0.8, 0.9, 1.0).
* **Legend (Bottom-Right):**
* Blue line with circle markers: "k=1"
* Coral/Salmon dashed line with square markers: "k=2"
### Detailed Analysis
* **k=1 (Blue Line):**
* Trend: The line slopes upward, indicating an increasing exact match percentage as the data percentage increases.
* Data Points:
* At 0.0 Data Percentage, Exact Match is approximately 0%.
* At 0.1 Data Percentage, Exact Match is approximately 32%.
* At 0.2 Data Percentage, Exact Match is approximately 54%.
* At 0.3 Data Percentage, Exact Match is approximately 65%.
* At 0.4 Data Percentage, Exact Match is approximately 70%.
* At 0.5 Data Percentage, Exact Match is approximately 78%.
* At 0.6 Data Percentage, Exact Match is approximately 86%.
* At 0.7 Data Percentage, Exact Match is approximately 90%.
* At 0.8 Data Percentage, Exact Match is approximately 92%.
* At 0.9 Data Percentage, Exact Match is approximately 92%.
* At 1.0 Data Percentage, Exact Match is approximately 92%.
* **k=2 (Coral/Salmon Dashed Line):**
* Trend: The line slopes downward after an initial increase, indicating a decreasing exact match percentage as the data percentage increases beyond a certain point.
* Data Points:
* At 0.0 Data Percentage, Exact Match is approximately 92%.
* At 0.1 Data Percentage, Exact Match is approximately 93%.
* At 0.2 Data Percentage, Exact Match is approximately 90%.
* At 0.3 Data Percentage, Exact Match is approximately 85%.
* At 0.4 Data Percentage, Exact Match is approximately 70%.
* At 0.5 Data Percentage, Exact Match is approximately 38%.
* At 0.6 Data Percentage, Exact Match is approximately 12%.
* At 0.7 Data Percentage, Exact Match is approximately 5%.
* At 0.8 Data Percentage, Exact Match is approximately 3%.
* At 0.9 Data Percentage, Exact Match is approximately 2%.
* At 1.0 Data Percentage, Exact Match is approximately 1%.
### Key Observations
* The "k=1" line shows a positive correlation between data percentage and exact match percentage.
* The "k=2" line shows a negative correlation between data percentage and exact match percentage after an initial increase.
* The two lines intersect at approximately 0.4 data percentage, where both have an exact match percentage of around 70%.
* For low data percentages (0.0 to 0.3), k=2 has a significantly higher exact match percentage than k=1.
* For high data percentages (0.6 to 1.0), k=1 has a significantly higher exact match percentage than k=2.
### Interpretation
The chart suggests that the optimal value of 'k' depends on the available data percentage. When the data percentage is low, k=2 performs better, providing a higher exact match percentage. However, as the data percentage increases, k=1 becomes the better choice, as its exact match percentage increases while k=2's decreases. This could indicate that k=2 is more effective with limited data, while k=1 benefits from a larger dataset. The intersection point at 0.4 data percentage represents a threshold where the performance of the two parameters switches.