```markdown
## Line Graph: Exact Match Percentage vs Data Percentage
### Overview
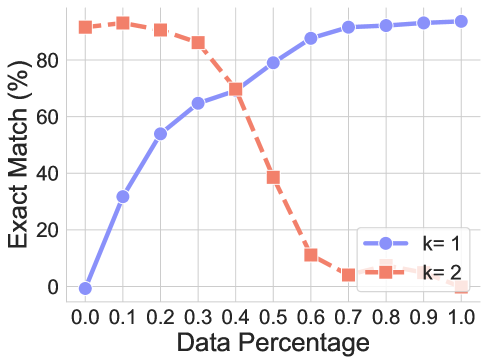
The image depicts a line graph comparing two data series (k=1 and k=2) across varying data percentages (0.0 to 1.0). The y-axis represents "Exact Match (%)" from 0 to 100, while the x-axis represents "Data Percentage" in increments of 0.1. Two distinct trends are observed: one series (k=1) increases steadily with data percentage, while the other (k=2) declines sharply after an initial plateau.
### Components/Axes
- **X-axis (Data Percentage)**: Labeled "Data Percentage" with markers at 0.0, 0.1, 0.2, ..., 1.0.
- **Y-axis (Exact Match %)**: Labeled "Exact Match (%)" with increments of 20 from 0 to 100.
- **Legend**: Located in the bottom-right corner, indicating:
- **Blue circles**: k=1
- **Red squares**: k=2
### Detailed Analysis
#### k=1 (Blue Circles)
- **Trend**: Starts at 0% Exact Match at 0.0 Data Percentage.
- **Key Points**:
- 0.1: ~30%
- 0.2: ~55%
- 0.3: ~65%
- 0.4: ~70%
- 0.5–1.0: Plateaus at ~85%.
- **Pattern**: Steep initial growth followed by stabilization.
#### k=2 (Red Squares)
- **Trend**: Begins at ~90% Exact Match at 0.0 Data Percentage.
- **Key Points**:
- 0.1: ~90%
- 0.2: ~85%
- 0.3: ~70%
- 0.4: ~40%
- 0.5: ~15%
- 0.6–1.0: Drops to ~0%.
- **Pattern**: Sharp decline after 0.3 Data Percentage.
### Key Observations
1. **Intersection Point**: Both series intersect near 0.3 Data Percentage (~65–70% Exact Match).
2. **Divergence**: k=1 improves with more data, while k=2 deteriorates sharply beyond 0.3.
3. **Asymptotic Behavior**: k=2 approaches 0% Exact Match as Data Percentage approaches 1.0.
### Interpretation
The graph suggests that k=1 (blue circles) demonstrates robust performance across all data percentages, with diminishing returns after 0.4. In contrast, k=2 (red squares) exhibits a critical threshold at ~0.3 Data Percentage, where its effectiveness collapses. This could indicate:
- **Model Sensitivity**: k=2 may overfit or rely on specific data patterns that degrade with increased data volume.
- **Threshold Effects**: k=1’s plateau at ~85% suggests diminishing marginal gains beyond 0.4 Data Percentage.
- **Practical Implications**: For applications requiring high Exact Match, k=