\n
## Bar Chart: Solve Rate for Math Word Problems (GSM8K)
### Overview
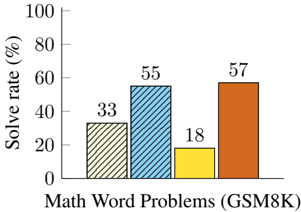
This is a bar chart displaying the solve rate (%) for Math Word Problems (GSM8K) across four different conditions or models. The y-axis represents the solve rate in percentage, ranging from 0 to 100. The x-axis represents the category "Math Word Problems (GSM8K)". Four bars are present, each representing a different solve rate.
### Components/Axes
* **X-axis Label:** "Math Word Problems (GSM8K)"
* **Y-axis Label:** "Solve rate (%)"
* **Y-axis Scale:** 0, 20, 40, 60, 80, 100
* **Bars:** Four bars with different colors and heights, representing different solve rates.
* **Bar 1 (Diagonal Stripes):** Solve rate of approximately 33%
* **Bar 2 (Light Blue):** Solve rate of approximately 55%
* **Bar 3 (Yellow):** Solve rate of approximately 18%
* **Bar 4 (Orange):** Solve rate of approximately 57%
### Detailed Analysis
The chart presents the solve rates for Math Word Problems (GSM8K) for four different scenarios.
* **Bar 1 (Diagonal Stripes):** The first bar, with diagonal stripes, has a height corresponding to approximately 33% on the y-axis.
* **Bar 2 (Light Blue):** The second bar, light blue in color, reaches approximately 55% on the y-axis.
* **Bar 3 (Yellow):** The third bar, yellow in color, has a height corresponding to approximately 18% on the y-axis.
* **Bar 4 (Orange):** The fourth bar, orange in color, reaches approximately 57% on the y-axis.
### Key Observations
The highest solve rate is approximately 57%, achieved by the orange bar. The lowest solve rate is approximately 18%, achieved by the yellow bar. The light blue bar (55%) and orange bar (57%) have similar solve rates. The diagonal striped bar (33%) is significantly lower than the light blue and orange bars.
### Interpretation
The data suggests that the solve rate for Math Word Problems (GSM8K) varies significantly depending on the condition or model being used. The yellow bar indicates a particularly low performance, while the orange bar shows the best performance. The difference in solve rates between the different bars could be due to variations in the algorithms, training data, or problem-solving strategies employed. The chart highlights the potential for improvement in solving Math Word Problems (GSM8K), as the highest solve rate is still below 60%. Without further context, it is difficult to determine the specific factors contributing to these differences. The chart implies that some approaches to solving these problems are more effective than others.