## Diagram: Social Media Interaction Models
### Overview
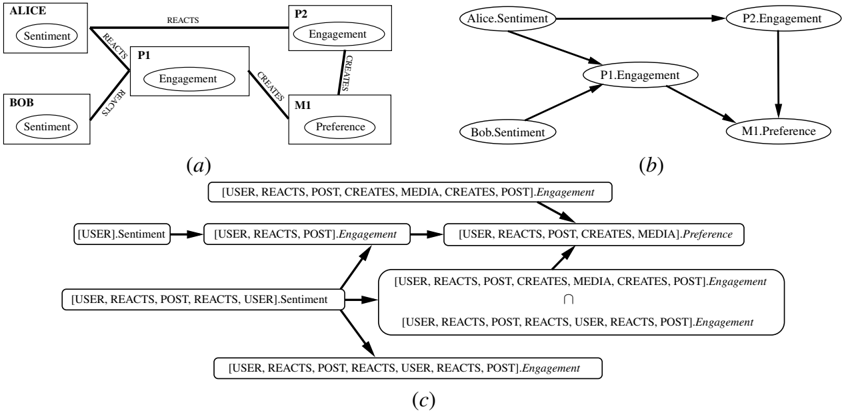
The image presents three diagrams (a, b, and c) illustrating different models of social media interaction. Each diagram depicts relationships between users (Alice, Bob), posts (P1, P2), media (M1), and their associated sentiments, engagement, and preferences. The diagrams use nodes to represent entities and directed edges to represent relationships or flow of influence.
### Components/Axes
**Diagram (a):**
* **Nodes:**
* ALICE: Contains "Sentiment"
* BOB: Contains "Sentiment"
* P1: Contains "Engagement"
* P2: Contains "Engagement"
* M1: Contains "Preference"
* **Edges:**
* ALICE -> P1: Labeled "REACTS"
* BOB -> P1: Labeled "REACTS"
* P1 -> P2: Labeled "REACTS"
* P1 -> M1: Labeled "CREATES"
* P2 -> M1: Labeled "CREATES"
**Diagram (b):**
* **Nodes:**
* Alice.Sentiment
* Bob.Sentiment
* P1.Engagement
* P2.Engagement
* M1.Preference
* **Edges:**
* Alice.Sentiment -> P1.Engagement
* Bob.Sentiment -> P1.Engagement
* P1.Engagement -> P2.Engagement
* P1.Engagement -> M1.Preference
* P2.Engagement -> M1.Preference
* Alice.Sentiment -> P2.Engagement
**Diagram (c):**
* **Nodes:**
* \[USER].Sentiment
* \[USER, REACTS, POST].Engagement
* \[USER, REACTS, POST, CREATES, MEDIA].Preference
* \[USER, REACTS, POST, CREATES, MEDIA, CREATES, POST].Engagement
* \[USER, REACTS, POST, REACTS, USER].Sentiment
* \[USER, REACTS, POST, REACTS, USER, REACTS, POST].Engagement (appears twice, with an intersection symbol between them)
* \[USER, REACTS, POST, REACTS, USER, REACTS, POST].Engagement
* **Edges:**
* \[USER].Sentiment -> \[USER, REACTS, POST].Engagement
* \[USER, REACTS, POST].Engagement -> \[USER, REACTS, POST, CREATES, MEDIA].Preference
* \[USER, REACTS, POST].Engagement -> \[USER, REACTS, POST, CREATES, MEDIA, CREATES, POST].Engagement
* \[USER, REACTS, POST, REACTS, USER].Sentiment -> \[USER, REACTS, POST].Engagement
* \[USER, REACTS, POST, REACTS, USER].Sentiment -> \[USER, REACTS, POST, REACTS, USER, REACTS, POST].Engagement
* \[USER, REACTS, POST, CREATES, MEDIA, CREATES, POST].Engagement -> the intersection of the two \[USER, REACTS, POST, REACTS, USER, REACTS, POST].Engagement nodes
### Detailed Analysis or ### Content Details
**Diagram (a):**
* Alice and Bob's sentiments influence post P1's engagement.
* Post P1's engagement influences post P2's engagement.
* Both P1 and P2 create media M1's preference.
**Diagram (b):**
* Alice's and Bob's sentiments directly influence P1's engagement.
* P1's engagement influences P2's engagement and M1's preference.
* P2's engagement also influences M1's preference.
* Alice's sentiment also influences P2's engagement.
**Diagram (c):**
* This diagram uses set notation to represent the relationships.
* A user's sentiment leads to engagement.
* Engagement leads to preference.
* Reacting users' sentiments lead to engagement.
* Engagement and reacting users' sentiments lead to a more specific type of engagement.
### Key Observations
* Diagram (a) provides a high-level overview of the interactions.
* Diagram (b) refines the model by specifying the entities with their attributes (e.g., Alice.Sentiment).
* Diagram (c) uses set notation to represent the relationships, providing a more abstract view.
### Interpretation
The diagrams illustrate how user sentiments, post engagement, and media preferences are interconnected in a social media environment. Diagram (a) shows a basic model, while diagram (b) provides a more detailed view with specific entities. Diagram (c) abstracts the relationships using set notation, highlighting the roles of users, reactions, posts, and media in shaping engagement and preferences. The intersection in diagram (c) suggests a combined influence or a specific type of engagement resulting from multiple factors. The diagrams collectively demonstrate the complex interplay of factors that drive social media interactions.