## Diagram: User Interaction Model in Social Media Context
### Overview
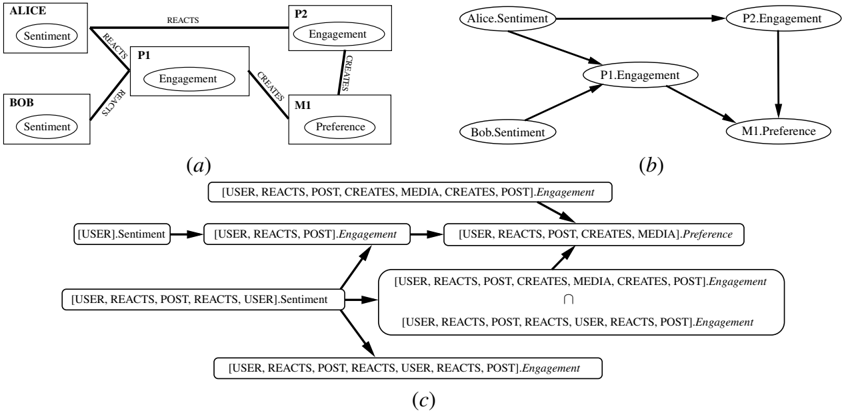
The image contains three interconnected diagrams (a, b, c) illustrating a user interaction model involving sentiment analysis, engagement, and preference formation in a social media environment. The diagrams use labeled nodes, directional arrows, and set operations to represent relationships between users, posts, media, and system components.
### Components/Axes
**Diagram (a):**
- **Nodes:**
- `ALICE.Sentiment`, `BOB.Sentiment` (user sentiments)
- `P1.Engagement`, `P2.Engagement` (platform engagement metrics)
- `M1.Preference` (media preference)
- `P1`, `P2`, `MI` (platform/user interaction nodes)
- **Arrows:**
- `REACTS`, `CREATES`, `SLOWS`, `SLIDER` (interaction types)
- Set operations: `∩` (intersection), `∪` (union)
**Diagram (b):**
- **Nodes:**
- `Alice.Sentiment`, `Bob.Sentiment`
- `P1.Engagement`, `M1.Preference`
- **Arrows:**
- Direct connections between sentiment → engagement → preference
**Diagram (c):**
- **Nodes:**
- `[USER]`, `[SENTIMENT]`, `[REACTS]`, `[POST]`, `[CREATES]`, `[MEDIA]`, `[PREFERENCE]`
- **Arrows:**
- Process flows: `USER → REACTS → POST → CREATES → MEDIA → PREFERENCE`
- Set operations: `∩`, `∪`
### Detailed Analysis
**Diagram (a):**
- **Structure:**
- Users (ALICE, BOB) generate sentiments that influence platform engagement (`P1`, `P2`).
- Engagement metrics (`P1.Engagement`, `P2.Engagement`) are created through interactions (`REACTS`, `CREATES`).
- `M1.Preference` is derived from engagement metrics via set operations (`∩`, `∪`).
- **Key Relationships:**
- `ALICE.Sentiment` and `BOB.Sentiment` → `P1.Engagement` (via `REACTS`).
- `P1.Engagement` → `M1.Preference` (via `CREATES`).
**Diagram (b):**
- **Simplified Flow:**
- `Alice.Sentiment` and `Bob.Sentiment` directly influence `P1.Engagement`.
- `P1.Engagement` determines `M1.Preference`.
- **Notable:** Lacks explicit user labels (e.g., `ALICE`, `BOB`) but retains sentiment and engagement labels.
**Diagram (c):**
- **Process Flow:**
1. `[USER]` generates `[SENTIMENT]`.
2. `[USER]` `[REACTS]` to `[POST]`, which `[CREATES]` `[MEDIA]`.
3. `[MEDIA]` contributes to `[PREFERENCE]` via set operations (`∩`, `∪`).
4. `[USER]` `[REACTS]` and `[POST]` again to form `[Engagement]`.
- **Complexity:** Explicitly models iterative user actions and their cumulative impact on engagement and preference.
### Key Observations
1. **Sentiment → Engagement → Preference:** All diagrams emphasize a causal chain from user sentiment to platform engagement and ultimately to preference formation.
2. **Set Operations:** Diagram (c) uses `∩` and `∪` to model how multiple user actions (e.g., reactions, posts) combine to shape preferences.
3. **Platform vs. User Roles:** Diagrams (a) and (c) distinguish between platform components (`P1`, `P2`, `MI`) and user actions (`USER`, `REACTS`, `POST`).
4. **Simplification in (b):** Diagram (b) abstracts away user-specific labels, focusing on high-level sentiment-engagement-preference relationships.
### Interpretation
The diagrams collectively model how user-generated content and interactions in social media platforms drive engagement metrics and shape preferences. Key insights:
- **User Agency:** Users (`ALICE`, `BOB`) actively shape platform dynamics through sentiment and actions (`REACTS`, `POST`).
- **Platform Feedback Loops:** Engagement metrics (`P1.Engagement`, `P2.Engagement`) are both influenced by and influence user preferences (`M1.Preference`).
- **Media as Mediator:** Diagram (c) highlights media creation as a critical intermediary between user actions and preference formation.
- **Set Theory Application:** The use of `∩` and `∪` suggests preferences are aggregated from diverse user interactions, not isolated events.
This model could inform algorithms for content recommendation, sentiment-driven engagement optimization, or preference-based media curation in social platforms.