## Violin Plot: Token Count Distribution by Data Source and Model
### Overview
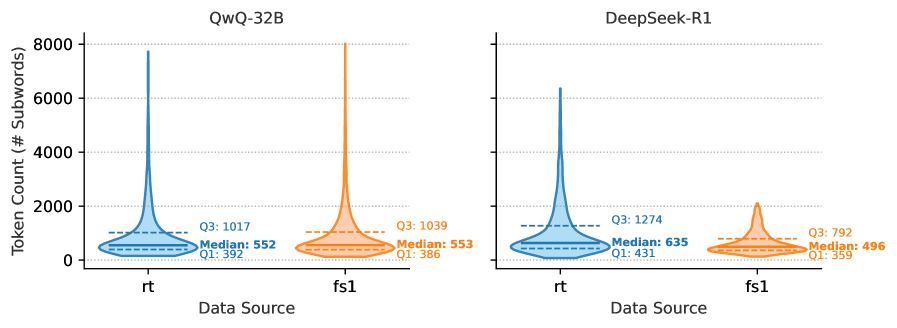
The image presents two violin plots comparing the distribution of token counts (number of subwords) for two language models, QwQ-32B and DeepSeek-R1, across two data sources, 'rt' and 'fs1'. Each violin plot shows the distribution's shape, median, first quartile (Q1), and third quartile (Q3).
### Components/Axes
* **Title (Left Plot):** QwQ-32B
* **Title (Right Plot):** DeepSeek-R1
* **Y-axis:** Token Count (# Subwords), ranging from 0 to 8000 with gridlines at intervals of 2000.
* **X-axis:** Data Source, with two categories: 'rt' and 'fs1'.
* **Violin Plot Colors:** Blue for 'rt' data source, Orange for 'fs1' data source.
* **Quartile Markers:** Dashed lines indicate the first quartile (Q1) and third quartile (Q3).
* **Median Marker:** Text labels indicate the median value.
### Detailed Analysis
**QwQ-32B (Left Plot):**
* **rt (Blue):**
* The violin plot is centered around lower token counts, with a long tail extending to higher counts.
* Q1: 392
* Median: 552
* Q3: 1017
* **fs1 (Orange):**
* The violin plot is also centered around lower token counts, with a long tail extending to higher counts.
* Q1: 386
* Median: 553
* Q3: 1039
**DeepSeek-R1 (Right Plot):**
* **rt (Blue):**
* The violin plot is centered around lower token counts, with a long tail extending to higher counts.
* Q1: 431
* Median: 635
* Q3: 1274
* **fs1 (Orange):**
* The violin plot is centered around lower token counts, with a shorter tail compared to the 'rt' data.
* Q1: 359
* Median: 496
* Q3: 792
### Key Observations
* For QwQ-32B, the median token counts are nearly identical for both 'rt' and 'fs1' data sources (552 vs 553).
* For DeepSeek-R1, the median token count is higher for the 'rt' data source (635) compared to 'fs1' (496).
* The Q3 values are higher than the median values for all data source and model combinations, indicating a right-skewed distribution.
* DeepSeek-R1 has a higher Q3 value for 'rt' (1274) compared to QwQ-32B (1017), suggesting a wider range of higher token counts in the 'rt' data for DeepSeek-R1.
### Interpretation
The violin plots provide a visual representation of the distribution of token counts for the two language models across the two data sources. The data suggests that:
* QwQ-32B exhibits similar token count distributions for both 'rt' and 'fs1' data sources, as indicated by the nearly identical median values.
* DeepSeek-R1 shows a noticeable difference in token count distributions between the two data sources, with 'rt' having a higher median and Q3 compared to 'fs1'. This could indicate that DeepSeek-R1 processes or tokenizes the 'rt' data differently, resulting in a higher number of subwords.
* The right-skewed distributions observed in all violin plots suggest that while most data points have lower token counts, there are instances with significantly higher token counts, contributing to the long tails.
* The differences in token count distributions between the models and data sources could be attributed to variations in the models' architectures, training data, or tokenization strategies. Further investigation would be needed to determine the specific factors contributing to these differences.