\n
## Violin Plots: Token Count Distribution by Data Source and Model
### Overview
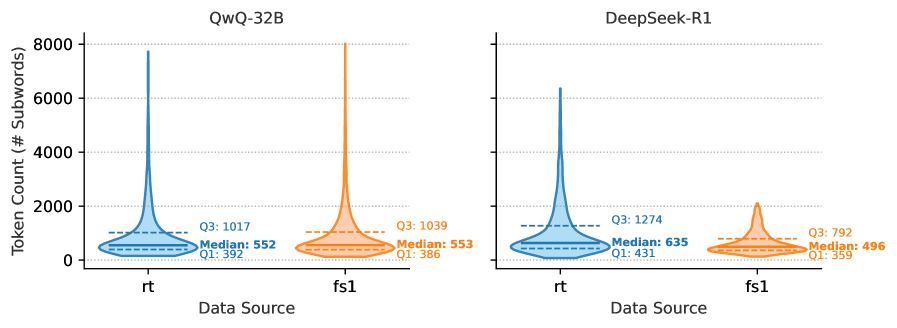
The image presents two pairs of violin plots, comparing the distribution of token counts for two different data sources ("rt" and "fs1") across two different models: "QwQ-32B" and "DeepSeek-R1". The y-axis represents the "Token Count (# Subwords)", while the x-axis represents the "Data Source". Each violin plot also displays the median, first quartile (Q1), and third quartile (Q3) of the distribution.
### Components/Axes
* **X-axis:** "Data Source" with two categories: "rt" and "fs1".
* **Y-axis:** "Token Count (# Subwords)" ranging from approximately 0 to 8000.
* **Models:** Two models are compared: "QwQ-32B" (left plots) and "DeepSeek-R1" (right plots).
* **Violin Plots:** Each plot represents the distribution of token counts for a specific data source and model combination.
* **Statistical Markers:** Each violin plot includes:
* Median (indicated by a dashed horizontal line)
* Q1 (First Quartile, indicated by a dashed horizontal line)
* Q3 (Third Quartile, indicated by a dashed horizontal line)
### Detailed Analysis
**QwQ-32B (Left Plots)**
* **rt Data Source:** The violin plot for "rt" is centered around a lower token count. The distribution is relatively narrow.
* Median: 552
* Q1: 392
* Q3: 1017
* **fs1 Data Source:** The violin plot for "fs1" is centered around a higher token count and is wider than the "rt" plot.
* Median: 553
* Q1: 386
* Q3: 1039
**DeepSeek-R1 (Right Plots)**
* **rt Data Source:** The violin plot for "rt" is similar in shape to the QwQ-32B "rt" plot, but slightly shifted to the right (higher token counts).
* Median: 635
* Q1: 431
* Q3: 1274
* **fs1 Data Source:** The violin plot for "fs1" is similar in shape to the QwQ-32B "fs1" plot, but shifted to the left (lower token counts).
* Median: 496
* Q1: 359
* Q3: 792
### Key Observations
* For both models, the "fs1" data source consistently exhibits a higher median and wider distribution of token counts compared to the "rt" data source.
* The DeepSeek-R1 model generally shows higher token counts for the "rt" data source compared to the QwQ-32B model.
* The DeepSeek-R1 model shows lower token counts for the "fs1" data source compared to the QwQ-32B model.
* The distributions are not symmetrical, with a longer tail extending towards higher token counts in both cases.
### Interpretation
The data suggests that the "fs1" data source inherently leads to longer sequences (higher token counts) than the "rt" data source, regardless of the model used. This could be due to the nature of the content within each data source – "fs1" might contain more verbose or complex text.
The differences in token counts between the models for each data source indicate that the models process the data differently. DeepSeek-R1 appears to generate longer sequences when processing "rt" data, while QwQ-32B generates longer sequences when processing "fs1" data. This could be related to the models' architectures, training data, or tokenization methods.
The violin plots effectively visualize the spread and central tendency of the token counts, allowing for a clear comparison between data sources and models. The quartiles provide additional information about the distribution's shape and variability. The asymmetry of the distributions suggests that there are occasional instances of very long sequences that contribute to the tail of the plots.