## Violin Plot: Token Count Distribution by Data Source and Model
### Overview
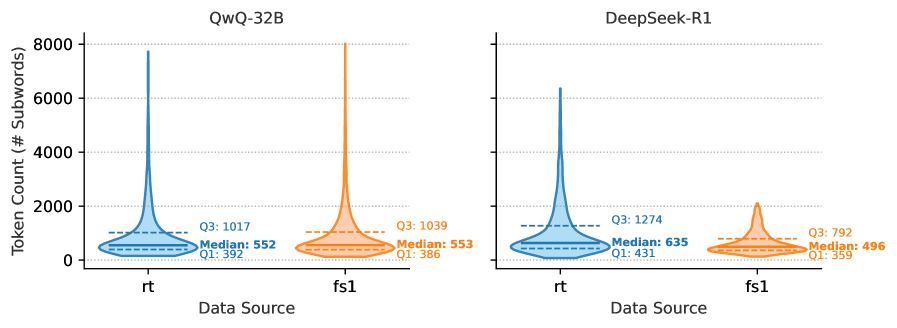
The image presents a dual-panel violin plot comparing token count distributions across two data sources (`rt` and `fs1`) for two AI models: **QwQ-32B** (blue) and **DeepSeek-R1** (orange). Each violin plot visualizes the distribution of subword tokens, with medians and quartile ranges annotated.
---
### Components/Axes
- **X-Axis (Data Source)**:
- Categories: `rt` (left) and `fs1` (right).
- **Y-Axis (Token Count)**:
- Scale: 0 to 8,000 subwords.
- **Legends**:
- **Left Panel (QwQ-32B)**: Blue color.
- **Right Panel (DeepSeek-R1)**: Orange color.
- **Annotations**:
- Median lines (solid horizontal lines).
- Quartile ranges (dashed horizontal lines labeled `Q1` and `Q3`).
---
### Detailed Analysis
#### QwQ-32B (Blue)
- **`rt`**:
- Median: ~552 subwords.
- Q1: ~392 subwords.
- Q3: ~1,017 subwords.
- Distribution: Sharp peak at median, with a long tail extending to ~8,000 subwords (outlier).
- **`fs1`**:
- Median: ~553 subwords.
- Q1: ~386 subwords.
- Q3: ~1,039 subwords.
- Distribution: Symmetric, with a narrower spread than `rt`.
#### DeepSeek-R1 (Orange)
- **`rt`**:
- Median: ~635 subwords.
- Q1: ~431 subwords.
- Q3: ~1,274 subwords.
- Distribution: Higher median than QwQ-32B, with a pronounced outlier at ~6,000 subwords.
- **`fs1`**:
- Median: ~496 subwords.
- Q1: ~359 subwords.
- Q3: ~792 subwords.
- Distribution: Narrower and more symmetric than `rt`.
---
### Key Observations
1. **Model-Specific Trends**:
- **QwQ-32B** shows near-identical medians for `rt` and `fs1` (~552 vs. ~553), suggesting consistent performance across data sources.
- **DeepSeek-R1** has a significantly higher median for `rt` (~635) compared to `fs1` (~496), indicating data-source-dependent behavior.
2. **Outliers**:
- Both models exhibit extreme values in `rt` (QwQ-32B: ~8,000; DeepSeek-R1: ~6,000), suggesting rare high-token-count events.
3. **Quartile Spread**:
- QwQ-32B’s `rt` has a wider interquartile range (Q1–Q3: ~625 subwords) compared to DeepSeek-R1’s `rt` (~843 subwords), implying greater variability in QwQ-32B’s `rt` data.
---
### Interpretation
- **Data Source Impact**:
- DeepSeek-R1 processes more tokens on average for `rt` data, while QwQ-32B shows minimal difference between `rt` and `fs1`.
- **Efficiency Insights**:
- The lower median for DeepSeek-R1’s `fs1` (~496) suggests it may handle `fs1` data more efficiently, though with less variability.
- **Outlier Implications**:
- The extreme values in `rt` for both models could indicate anomalies or specialized use cases requiring high token counts (e.g., long-form text processing).
The data highlights model-specific strengths: QwQ-32B demonstrates consistency, while DeepSeek-R1 excels in `rt` token handling but shows greater variability.