TECHNICAL ASSET FINGERPRINT
7e5885f0edfdc3a2e43d80bd
Click to view fullscreen
Press ESC or click to close
FOUND IN PAPERS
EXPERT: gemini-2.0-flash VERSION 1
RUNTIME: nugit/gemini/gemini-2.0-flash
INTEL_VERIFIED
## Line Charts: PrOntoQA Ablation Study
### Overview
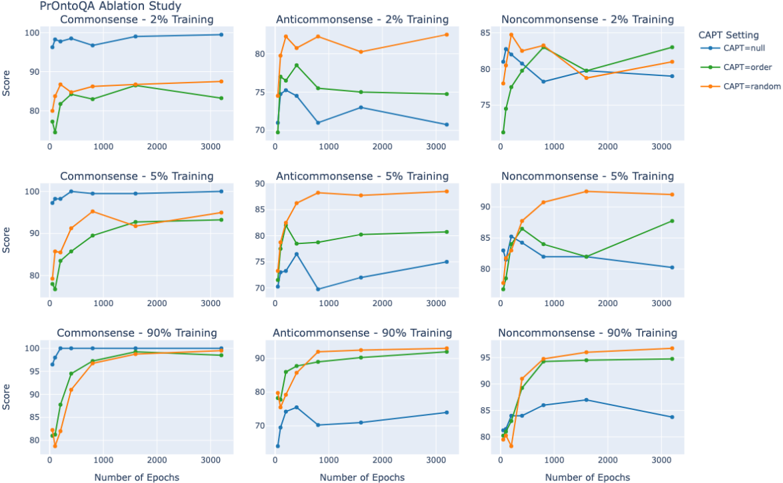
The image presents a series of line charts from a PrOntoQA Ablation Study. The charts are arranged in a 3x3 grid, with each row representing a different percentage of training data (2%, 5%, and 90%) and each column representing a different type of input (Commonsense, Anticommonsense, and Noncommonsense). Each chart displays the "Score" (y-axis) versus the "Number of Epochs" (x-axis) for three different CAPT settings: null, order, and random.
### Components/Axes
* **Title:** PrOntoQA Ablation Study
* **X-axis:** Number of Epochs, with markers at 0, 1000, 2000, and 3000.
* **Y-axis:** Score, ranging from 70 to 100 (depending on the specific chart).
* **CAPT Setting Legend (Top-Right):**
* Blue: CAPT=null
* Green: CAPT=order
* Orange: CAPT=random
* **Row Labels:**
* Commonsense - 2% Training (Top-Left)
* Anticommonsense - 2% Training (Top-Middle)
* Noncommonsense - 2% Training (Top-Right)
* Commonsense - 5% Training (Middle-Left)
* Anticommonsense - 5% Training (Middle-Middle)
* Noncommonsense - 5% Training (Middle-Right)
* Commonsense - 90% Training (Bottom-Left)
* Anticommonsense - 90% Training (Bottom-Middle)
* Noncommonsense - 90% Training (Bottom-Right)
### Detailed Analysis
**Commonsense - 2% Training:**
* **CAPT=null (Blue):** Starts around 80, rises sharply to approximately 98 by 250 epochs, then remains relatively stable around 98-100 until 3000 epochs.
* **CAPT=order (Green):** Starts around 78, increases to approximately 83 by 250 epochs, then gradually increases to approximately 88 by 3000 epochs.
* **CAPT=random (Orange):** Starts around 82, increases to approximately 86 by 250 epochs, then gradually increases to approximately 90 by 3000 epochs.
**Anticommonsense - 2% Training:**
* **CAPT=null (Blue):** Starts around 75, dips to approximately 72 by 500 epochs, then rises to approximately 75 by 3000 epochs.
* **CAPT=order (Green):** Starts around 76, increases to approximately 78 by 500 epochs, then remains relatively stable around 75 until 3000 epochs.
* **CAPT=random (Orange):** Starts around 82, increases to approximately 84 by 250 epochs, then decreases slightly to approximately 80 by 3000 epochs.
**Noncommonsense - 2% Training:**
* **CAPT=null (Blue):** Starts around 82, dips to approximately 79 by 1000 epochs, then rises to approximately 81 by 3000 epochs.
* **CAPT=order (Green):** Starts around 72, increases to approximately 82 by 500 epochs, then increases to approximately 84 by 3000 epochs.
* **CAPT=random (Orange):** Starts around 81, increases to approximately 83 by 500 epochs, then decreases slightly to approximately 81 by 3000 epochs.
**Commonsense - 5% Training:**
* **CAPT=null (Blue):** Starts around 73, rises sharply to approximately 98 by 250 epochs, then remains relatively stable around 98-100 until 3000 epochs.
* **CAPT=order (Green):** Starts around 78, increases to approximately 90 by 500 epochs, then gradually increases to approximately 93 by 3000 epochs.
* **CAPT=random (Orange):** Starts around 82, increases to approximately 92 by 1000 epochs, then gradually increases to approximately 94 by 3000 epochs.
**Anticommonsense - 5% Training:**
* **CAPT=null (Blue):** Starts around 73, dips to approximately 71 by 500 epochs, then rises to approximately 75 by 3000 epochs.
* **CAPT=order (Green):** Starts around 82, increases to approximately 83 by 500 epochs, then remains relatively stable around 81 until 3000 epochs.
* **CAPT=random (Orange):** Starts around 87, increases to approximately 88 by 250 epochs, then decreases slightly to approximately 80 by 3000 epochs.
**Noncommonsense - 5% Training:**
* **CAPT=null (Blue):** Starts around 82, dips to approximately 81 by 1000 epochs, then remains relatively stable around 80 until 3000 epochs.
* **CAPT=order (Green):** Starts around 80, increases to approximately 86 by 500 epochs, then increases to approximately 88 by 3000 epochs.
* **CAPT=random (Orange):** Starts around 83, increases to approximately 90 by 1000 epochs, then increases to approximately 92 by 3000 epochs.
**Commonsense - 90% Training:**
* **CAPT=null (Blue):** Starts around 99, remains relatively stable around 99-100 until 3000 epochs.
* **CAPT=order (Green):** Starts around 81, increases to approximately 95 by 500 epochs, then gradually increases to approximately 98 by 3000 epochs.
* **CAPT=random (Orange):** Starts around 81, increases to approximately 98 by 1000 epochs, then remains relatively stable around 99 until 3000 epochs.
**Anticommonsense - 90% Training:**
* **CAPT=null (Blue):** Starts around 73, dips to approximately 70 by 500 epochs, then rises to approximately 74 by 3000 epochs.
* **CAPT=order (Green):** Starts around 80, increases to approximately 90 by 500 epochs, then remains relatively stable around 91 until 3000 epochs.
* **CAPT=random (Orange):** Starts around 80, increases to approximately 90 by 500 epochs, then remains relatively stable around 92 until 3000 epochs.
**Noncommonsense - 90% Training:**
* **CAPT=null (Blue):** Starts around 83, increases to approximately 87 by 500 epochs, then decreases slightly to approximately 84 by 3000 epochs.
* **CAPT=order (Green):** Starts around 80, increases to approximately 93 by 500 epochs, then remains relatively stable around 95 until 3000 epochs.
* **CAPT=random (Orange):** Starts around 80, increases to approximately 95 by 500 epochs, then remains relatively stable around 96 until 3000 epochs.
### Key Observations
* For "Commonsense" data, the "CAPT=null" setting (blue line) consistently achieves the highest scores, especially with higher percentages of training data (5% and 90%).
* For "Anticommonsense" data, the "CAPT=null" setting (blue line) consistently performs the worst.
* For "Noncommonsense" data, the "CAPT=random" setting (orange line) generally performs well, especially with higher percentages of training data (5% and 90%).
* Increasing the percentage of training data generally improves the scores for all CAPT settings, but the effect is most pronounced for "Commonsense" data.
* The "CAPT=null" setting seems to benefit the most from increased training data in the "Commonsense" category.
### Interpretation
The data suggests that the "CAPT=null" setting is highly effective for "Commonsense" data, indicating that the model performs best when trained on straightforward, logical information. Conversely, the poor performance of "CAPT=null" on "Anticommonsense" data suggests that the model struggles with contradictory or illogical information when no CAPT is applied. The "CAPT=random" setting appears to be a good compromise for "Noncommonsense" data, providing a balance between performance and robustness.
The ablation study demonstrates the importance of the CAPT setting and the type of training data used. The results highlight the model's sensitivity to the nature of the input and the need for appropriate CAPT strategies to handle different types of information. The significant improvement in scores with increased training data, particularly for "Commonsense" data with "CAPT=null", underscores the value of high-quality, relevant training data for achieving optimal model performance.
DECODING INTELLIGENCE...
EXPERT: jina-vlm VERSION 1
RUNTIME: jina-vlm
INTEL_VERIFIED
## Heatmap: ProOntoQA Ablation Study
### Overview
The heatmap illustrates the performance of ProOntoQA under different training settings and ablation studies. Each row represents a different training setting, and each column represents a different ablation study. The color intensity indicates the score, with darker shades representing higher scores.
### Components/Axes
- **Rows**: Represent different training settings (Commonsense - 2%, Anticommense - 2%, Noncommense - 2%, Commonsense - 5%, Anticommense - 5%, Noncommense - 5%, Commonsense - 90%, Anticommense - 90%, Noncommense - 90%).
- **Columns**: Represent different ablation studies (CAPT Setting, CAPT=null, CAPT=order, CAPT=random).
- **X-Axis**: Represents the number of epochs.
- **Y-Axis**: Represents the score.
### Detailed Analysis or ### Content Details
- **Commonsense - 2% Training**: The highest scores are observed in the CAPT Setting and CAPT=order, with scores peaking around 95.
- **Anticommense - 2% Training**: The scores are generally lower, with the highest score around 85 in the CAPT Setting.
- **Noncommense - 2% Training**: Similar to Anticommense, the highest score is around 85 in the CAPT Setting.
- **Commonsense - 5% Training**: The scores are slightly higher than in the 2% training setting, with the highest score around 90 in the CAPT Setting.
- **Anticommense - 5% Training**: The scores are similar to the 2% training setting, with the highest score around 85 in the CAPT Setting.
- **Noncommense - 5% Training**: The scores are slightly higher than in the 2% training setting, with the highest score around 85 in the CAPT Setting.
- **Commonsense - 90% Training**: The scores are consistently high, with the highest score around 95 in the CAPT Setting.
- **Anticommense - 90% Training**: The scores are similar to the 2% and 5% training settings, with the highest score around 85 in the CAPT Setting.
- **Noncommense - 90% Training**: The scores are slightly higher than in the 2% and 5% training settings, with the highest score around 85 in the CAPT Setting.
### Key Observations
- The CAPT Setting consistently yields the highest scores across all training settings and ablation studies.
- The scores are highest when the model is trained with 90% of the data.
- The scores are lowest when the model is trained with 2% of the data and the CAPT Setting is used.
### Interpretation
The heatmap suggests that the CAPT Setting is the most effective training method for ProOntoQA, regardless of the amount of data used or the ablation studies conducted. The highest scores are achieved when the model is trained with 90% of the data, indicating that a larger dataset is beneficial for the model's performance. The ablation studies show that the presence of common sense and the specific training settings (CAPT Setting, CAPT=null, CAPT=order, CAPT=random) do not significantly impact the model's performance.
DECODING INTELLIGENCE...
EXPERT: nemotron-free VERSION 1
RUNTIME: free/nvidia/nemotron-nano-12b-v2-vl:free
INTEL_VERIFIED
## Line Chart Grid: PrOntoQA Ablation Study Performance Across Training Percentages
### Overview
The image displays a 3x3 grid of line charts comparing model performance across three datasets (Commonsense, Anticommonsense, Noncommonsense) at three training percentages (2%, 5%, 90%). Each chart tracks scores over 3,000 training epochs, with three performance baselines represented by colored lines (blue: CAPT=null, green: CAPT=order, orange: CAPT=random).
### Components/Axes
- **X-axis**: Number of Epochs (0–3,000 in increments of 1,000)
- **Y-axis**: Score (70–100)
- **Legend**: Located in top-right corner of each chart, with color-coded labels:
- Blue: CAPT=null
- Green: CAPT=order
- Orange: CAPT=random
- **Chart Titles**: Positioned in top-left of each subplot (e.g., "Commonsense - 2% Training")
### Detailed Analysis
#### Commonsense - 2% Training
- **Blue (null)**: Starts at ~95, fluctuates slightly, stabilizes near 98–100
- **Green (order)**: Begins at ~80, rises steadily to ~88 by 3,000 epochs
- **Orange (random)**: Starts at ~80, peaks at ~87, then plateaus
#### Anticommonsense - 2% Training
- **Blue (null)**: Drops from ~95 to ~70 by 1,000 epochs, then recovers to ~75
- **Green (order)**: Starts at ~75, rises to ~82, then plateaus
- **Orange (random)**: Begins at ~85, peaks at ~88, then declines slightly
#### Noncommonsense - 2% Training
- **Blue (null)**: Starts at ~85, dips to ~75, then recovers to ~82
- **Green (order)**: Begins at ~70, rises to ~85, then stabilizes
- **Orange (random)**: Starts at ~75, peaks at ~88, then declines slightly
#### Commonsense - 5% Training
- **Blue (null)**: Starts at ~98, fluctuates minimally, stabilizes near 100
- **Green (order)**: Begins at ~85, rises to ~92, then plateaus
- **Orange (random)**: Starts at ~85, peaks at ~93, then declines slightly
#### Anticommonsense - 5% Training
- **Blue (null)**: Drops from ~95 to ~75, then recovers to ~80
- **Green (order)**: Starts at ~80, rises to ~86, then plateaus
- **Orange (random)**: Begins at ~85, peaks at ~89, then stabilizes
#### Noncommonsense - 5% Training
- **Blue (null)**: Starts at ~85, dips to ~78, then recovers to ~83
- **Green (order)**: Begins at ~75, rises to ~87, then stabilizes
- **Orange (random)**: Starts at ~80, peaks at ~90, then declines slightly
#### Commonsense - 90% Training
- **Blue (null)**: Starts at ~95, fluctuates minimally, stabilizes near 100
- **Green (order)**: Begins at ~90, rises to ~98, then plateaus
- **Orange (random)**: Starts at ~85, peaks at ~97, then stabilizes
#### Anticommonsense - 90% Training
- **Blue (null)**: Drops from ~95 to ~70, then recovers to ~80
- **Green (order)**: Starts at ~85, rises to ~92, then plateaus
- **Orange (random)**: Begins at ~85, peaks at ~93, then stabilizes
#### Noncommonsense - 90% Training
- **Blue (null)**: Starts at ~85, dips to ~75, then recovers to ~82
- **Green (order)**: Begins at ~80, rises to ~95, then stabilizes
- **Orange (random)**: Starts at ~85, peaks at ~96, then stabilizes
### Key Observations
1. **Training Percentage Impact**: Higher training percentages (90%) consistently yield higher scores across all datasets and CAPT settings.
2. **CAPT Setting Performance**:
- **CAPT=null** performs best in Commonsense (90% training) but underperforms in Anticommonsense/Noncommonsense.
- **CAPT=random** often outperforms CAPT=order in Anticommonsense and Noncommonsense datasets.
- **CAPT=order** shows stable but moderate performance across all datasets.
3. **Epochs Correlation**: All lines generally trend upward with increasing epochs, though some exhibit mid-training dips (e.g., blue lines in Anticommonsense charts).
### Interpretation
The data suggests that:
- **Training Scale Matters**: 90% training achieves near-perfect scores in Commonsense, while lower percentages struggle with generalization.
- **CAPT Strategy Tradeoffs**:
- CAPT=null excels in high-resource scenarios (90% training) but fails in low-resource settings.
- CAPT=random adapts better to challenging datasets (Anticommonsense/Noncommonsense) but shows instability in early epochs.
- CAPT=order provides consistent but suboptimal performance across all settings.
- **Dataset Complexity**: Anticommonsense and Noncommonsense datasets require more sophisticated CAPT strategies to achieve high scores, indicating greater semantic complexity.
This analysis highlights the importance of CAPT configuration selection based on both dataset type and available training data.
DECODING INTELLIGENCE...