TECHNICAL ASSET FINGERPRINT
7e5885f0edfdc3a2e43d80bd
Click to view fullscreen
Press ESC or click to close
FOUND IN PAPERS
EXPERT: gemma-3-27b-it-free VERSION 1
RUNTIME: google-free/gemma-3-27b-it
INTEL_VERIFIED
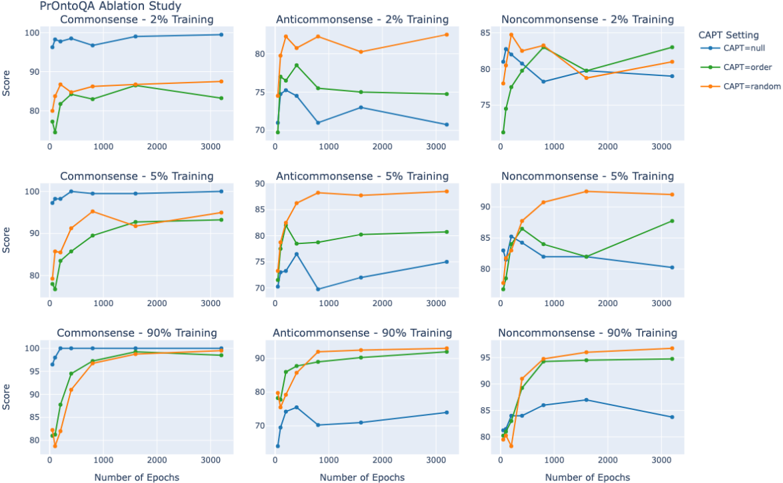
## Line Charts: PrOntoQA Ablation Study
### Overview
The image presents a 3x3 grid of line charts, visualizing the results of an ablation study for the PrOntoQA model. Each chart represents a different training data composition (Commonsense, Anticommonsense, Noncommonsense) combined with different percentages of training data (2%, 5%, 90%). The charts plot 'Score' against 'Number of Epochs' for various 'CAPT Setting' configurations.
### Components/Axes
* **X-axis:** Number of Epochs (ranging from 0 to 3000, with markers at 0, 1000, 2000, and 3000).
* **Y-axis:** Score (ranging from approximately 70 to 100, with markers at 70, 75, 80, 85, 90, 95, and 100).
* **Legend:** Located in the top-right corner of each chart, defining the lines:
* CAPT=null (represented by a blue line with circle markers)
* CAPT=ordinal (represented by a green line with circle markers)
* CAPT=random (represented by an orange line with circle markers)
* **Titles:** Each chart has a title indicating the data composition and training percentage (e.g., "Commonsense - 2% Training").
* **Overall Title:** "PrOntoQA Ablation Study" is positioned at the top-left of the entire image.
### Detailed Analysis or Content Details
**Chart 1: Commonsense - 2% Training**
* CAPT=null: Line starts at approximately 98, decreases to around 82 at 1000 epochs, then increases slightly to around 84 at 3000 epochs.
* CAPT=ordinal: Line starts at approximately 95, decreases to around 80 at 1000 epochs, then remains relatively stable around 81-82 at 3000 epochs.
* CAPT=random: Line starts at approximately 83, increases to around 92 at 1000 epochs, then decreases to around 88 at 3000 epochs.
**Chart 2: Anticommonsense - 2% Training**
* CAPT=null: Line starts at approximately 78, decreases to around 72 at 1000 epochs, then increases to around 75 at 3000 epochs.
* CAPT=ordinal: Line starts at approximately 75, remains relatively stable around 75-76 throughout the epochs.
* CAPT=random: Line starts at approximately 72, increases to around 78 at 1000 epochs, then decreases to around 74 at 3000 epochs.
**Chart 3: Noncommonsense - 2% Training**
* CAPT=null: Line starts at approximately 84, decreases to around 78 at 1000 epochs, then remains relatively stable around 78-80 at 3000 epochs.
* CAPT=ordinal: Line starts at approximately 82, decreases to around 78 at 1000 epochs, then remains relatively stable around 78-79 at 3000 epochs.
* CAPT=random: Line starts at approximately 85, decreases to around 80 at 1000 epochs, then increases to around 82 at 3000 epochs.
**Chart 4: Commonsense - 5% Training**
* CAPT=null: Line starts at approximately 98, decreases to around 83 at 1000 epochs, then increases to around 86 at 3000 epochs.
* CAPT=ordinal: Line starts at approximately 94, increases to around 96 at 1000 epochs, then remains relatively stable around 95-96 at 3000 epochs.
* CAPT=random: Line starts at approximately 83, increases to around 93 at 1000 epochs, then decreases to around 90 at 3000 epochs.
**Chart 5: Anticommonsense - 5% Training**
* CAPT=null: Line starts at approximately 82, decreases to around 75 at 1000 epochs, then increases to around 78 at 3000 epochs.
* CAPT=ordinal: Line starts at approximately 75, increases to around 85 at 1000 epochs, then decreases to around 82 at 3000 epochs.
* CAPT=random: Line starts at approximately 72, increases to around 82 at 1000 epochs, then remains relatively stable around 82-83 at 3000 epochs.
**Chart 6: Noncommonsense - 5% Training**
* CAPT=null: Line starts at approximately 87, decreases to around 82 at 1000 epochs, then remains relatively stable around 82-83 at 3000 epochs.
* CAPT=ordinal: Line starts at approximately 85, decreases to around 80 at 1000 epochs, then remains relatively stable around 80-81 at 3000 epochs.
* CAPT=random: Line starts at approximately 86, increases to around 88 at 1000 epochs, then decreases to around 85 at 3000 epochs.
**Chart 7: Commonsense - 90% Training**
* CAPT=null: Line starts at approximately 98, remains relatively stable around 98-99 throughout the epochs.
* CAPT=ordinal: Line starts at approximately 96, increases to around 99 at 1000 epochs, then remains relatively stable around 99-100 at 3000 epochs.
* CAPT=random: Line starts at approximately 84, increases to around 96 at 1000 epochs, then remains relatively stable around 96-97 at 3000 epochs.
**Chart 8: Anticommonsense - 90% Training**
* CAPT=null: Line starts at approximately 75, increases to around 85 at 1000 epochs, then remains relatively stable around 85-86 at 3000 epochs.
* CAPT=ordinal: Line starts at approximately 72, increases to around 90 at 1000 epochs, then remains relatively stable around 90-91 at 3000 epochs.
* CAPT=random: Line starts at approximately 70, increases to around 90 at 1000 epochs, then remains relatively stable around 90-91 at 3000 epochs.
**Chart 9: Noncommonsense - 90% Training**
* CAPT=null: Line starts at approximately 88, increases to around 93 at 1000 epochs, then remains relatively stable around 93-94 at 3000 epochs.
* CAPT=ordinal: Line starts at approximately 86, increases to around 95 at 1000 epochs, then remains relatively stable around 95-96 at 3000 epochs.
* CAPT=random: Line starts at approximately 85, increases to around 94 at 1000 epochs, then remains relatively stable around 94-95 at 3000 epochs.
### Key Observations
* Generally, performance (Score) decreases initially with increasing epochs, then plateaus or slightly increases.
* The 90% training data consistently yields the highest scores across all CAPT settings.
* The 'CAPT=ordinal' and 'CAPT=random' settings often outperform 'CAPT=null', especially with higher training data percentages.
* The 2% training data shows the most significant fluctuations in score across epochs.
* Anticommonsense data consistently shows lower scores compared to Commonsense and Noncommonsense data.
### Interpretation
The ablation study investigates the impact of different training data compositions and CAPT settings on the PrOntoQA model's performance. The results suggest that:
1. **Data Quantity Matters:** Increasing the training data percentage (from 2% to 90%) significantly improves the model's score, indicating that more training data leads to better generalization.
2. **CAPT Setting is Important:** The choice of CAPT setting influences performance. 'CAPT=ordinal' and 'CAPT=random' generally outperform 'CAPT=null', suggesting that incorporating some form of contextual information during training is beneficial.
3. **Data Type Affects Performance:** Commonsense and Noncommonsense data lead to higher scores than Anticommonsense data, implying that the model struggles with reasoning about contradictory or unusual scenarios.
4. **Initial Fluctuations:** The initial decrease in score with increasing epochs might be due to the model adjusting to the training data and overcoming initial overfitting. The subsequent plateau or slight increase suggests that the model is converging towards a stable solution.
The study provides valuable insights into the design and training of the PrOntoQA model, highlighting the importance of data quantity, CAPT setting, and data type for achieving optimal performance. The observed trends suggest that the model benefits from contextual information and struggles with reasoning about uncommon scenarios.
DECODING INTELLIGENCE...