## Line Chart Grid: PrOntoQA Ablation Study Performance Across Training Percentages
### Overview
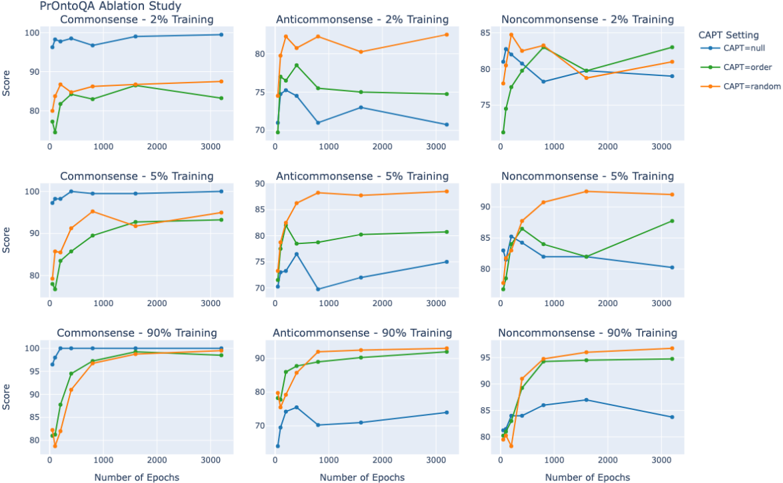
The image displays a 3x3 grid of line charts comparing model performance across three datasets (Commonsense, Anticommonsense, Noncommonsense) at three training percentages (2%, 5%, 90%). Each chart tracks scores over 3,000 training epochs, with three performance baselines represented by colored lines (blue: CAPT=null, green: CAPT=order, orange: CAPT=random).
### Components/Axes
- **X-axis**: Number of Epochs (0–3,000 in increments of 1,000)
- **Y-axis**: Score (70–100)
- **Legend**: Located in top-right corner of each chart, with color-coded labels:
- Blue: CAPT=null
- Green: CAPT=order
- Orange: CAPT=random
- **Chart Titles**: Positioned in top-left of each subplot (e.g., "Commonsense - 2% Training")
### Detailed Analysis
#### Commonsense - 2% Training
- **Blue (null)**: Starts at ~95, fluctuates slightly, stabilizes near 98–100
- **Green (order)**: Begins at ~80, rises steadily to ~88 by 3,000 epochs
- **Orange (random)**: Starts at ~80, peaks at ~87, then plateaus
#### Anticommonsense - 2% Training
- **Blue (null)**: Drops from ~95 to ~70 by 1,000 epochs, then recovers to ~75
- **Green (order)**: Starts at ~75, rises to ~82, then plateaus
- **Orange (random)**: Begins at ~85, peaks at ~88, then declines slightly
#### Noncommonsense - 2% Training
- **Blue (null)**: Starts at ~85, dips to ~75, then recovers to ~82
- **Green (order)**: Begins at ~70, rises to ~85, then stabilizes
- **Orange (random)**: Starts at ~75, peaks at ~88, then declines slightly
#### Commonsense - 5% Training
- **Blue (null)**: Starts at ~98, fluctuates minimally, stabilizes near 100
- **Green (order)**: Begins at ~85, rises to ~92, then plateaus
- **Orange (random)**: Starts at ~85, peaks at ~93, then declines slightly
#### Anticommonsense - 5% Training
- **Blue (null)**: Drops from ~95 to ~75, then recovers to ~80
- **Green (order)**: Starts at ~80, rises to ~86, then plateaus
- **Orange (random)**: Begins at ~85, peaks at ~89, then stabilizes
#### Noncommonsense - 5% Training
- **Blue (null)**: Starts at ~85, dips to ~78, then recovers to ~83
- **Green (order)**: Begins at ~75, rises to ~87, then stabilizes
- **Orange (random)**: Starts at ~80, peaks at ~90, then declines slightly
#### Commonsense - 90% Training
- **Blue (null)**: Starts at ~95, fluctuates minimally, stabilizes near 100
- **Green (order)**: Begins at ~90, rises to ~98, then plateaus
- **Orange (random)**: Starts at ~85, peaks at ~97, then stabilizes
#### Anticommonsense - 90% Training
- **Blue (null)**: Drops from ~95 to ~70, then recovers to ~80
- **Green (order)**: Starts at ~85, rises to ~92, then plateaus
- **Orange (random)**: Begins at ~85, peaks at ~93, then stabilizes
#### Noncommonsense - 90% Training
- **Blue (null)**: Starts at ~85, dips to ~75, then recovers to ~82
- **Green (order)**: Begins at ~80, rises to ~95, then stabilizes
- **Orange (random)**: Starts at ~85, peaks at ~96, then stabilizes
### Key Observations
1. **Training Percentage Impact**: Higher training percentages (90%) consistently yield higher scores across all datasets and CAPT settings.
2. **CAPT Setting Performance**:
- **CAPT=null** performs best in Commonsense (90% training) but underperforms in Anticommonsense/Noncommonsense.
- **CAPT=random** often outperforms CAPT=order in Anticommonsense and Noncommonsense datasets.
- **CAPT=order** shows stable but moderate performance across all datasets.
3. **Epochs Correlation**: All lines generally trend upward with increasing epochs, though some exhibit mid-training dips (e.g., blue lines in Anticommonsense charts).
### Interpretation
The data suggests that:
- **Training Scale Matters**: 90% training achieves near-perfect scores in Commonsense, while lower percentages struggle with generalization.
- **CAPT Strategy Tradeoffs**:
- CAPT=null excels in high-resource scenarios (90% training) but fails in low-resource settings.
- CAPT=random adapts better to challenging datasets (Anticommonsense/Noncommonsense) but shows instability in early epochs.
- CAPT=order provides consistent but suboptimal performance across all settings.
- **Dataset Complexity**: Anticommonsense and Noncommonsense datasets require more sophisticated CAPT strategies to achieve high scores, indicating greater semantic complexity.
This analysis highlights the importance of CAPT configuration selection based on both dataset type and available training data.