\n
## Histogram: Confidence vs. Count for Correct/Incorrect Answers
### Overview
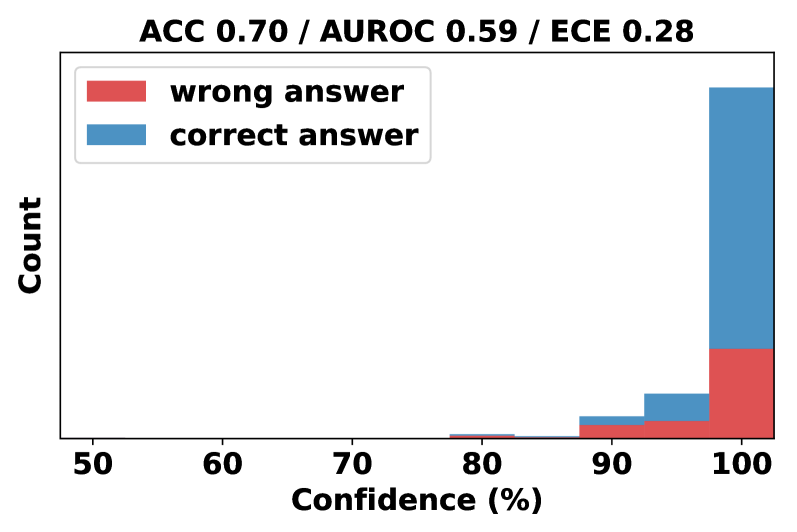
This image presents a histogram visualizing the distribution of confidence levels for correct and incorrect answers. The x-axis represents confidence (in percentage), and the y-axis represents the count of answers falling within each confidence bin. Two data series are displayed: one for "wrong answer" and one for "correct answer". The top of the image displays overall performance metrics.
### Components/Axes
* **Title:** "ACC 0.70 / AUROC 0.59 / ECE 0.28"
* **X-axis Label:** "Confidence (%)"
* Scale: 50 to 100, with tick marks at 60, 70, 80, 90.
* **Y-axis Label:** "Count"
* **Legend:** Located in the top-left corner.
* "wrong answer" - represented by the color red.
* "correct answer" - represented by the color blue.
### Detailed Analysis
The histogram shows the distribution of confidence levels for both correct and incorrect answers.
* **Correct Answer (Blue):** The distribution of correct answers is heavily skewed towards high confidence levels.
* Around 90% confidence: Approximately 2-3 count.
* 95% confidence: Approximately 10-12 count.
* 100% confidence: Approximately 30-35 count.
* The count of correct answers is very low for confidence levels below 90%.
* **Wrong Answer (Red):** The distribution of wrong answers is more spread out, with a significant number of answers clustered around the 90-100% confidence range, but also extending down to lower confidence levels.
* Around 90% confidence: Approximately 5-6 count.
* 95% confidence: Approximately 10-12 count.
* 100% confidence: Approximately 15-20 count.
* There is a noticeable, though smaller, presence of wrong answers in the 50-90% confidence range.
### Key Observations
* The model exhibits a tendency to be highly confident when it is correct.
* A significant number of incorrect answers are also associated with high confidence levels (90-100%), indicating overconfidence.
* The distribution of wrong answers is broader than that of correct answers, suggesting the model is more uncertain when it makes mistakes.
* The overall accuracy (ACC) is 0.70, indicating that 70% of the answers are correct.
* The Area Under the Receiver Operating Characteristic curve (AUROC) is 0.59, which is only slightly better than random chance (0.5).
* The Expected Calibration Error (ECE) is 0.28, indicating a moderate level of miscalibration.
### Interpretation
The data suggests that while the model achieves a reasonable level of accuracy (70%), it is poorly calibrated. This means that the confidence scores it outputs do not accurately reflect the probability of being correct. The low AUROC score further supports this conclusion. The high ECE value confirms the model's miscalibration. The fact that many incorrect answers are given with high confidence is a significant issue, as it could lead to users over-relying on the model's predictions. The model is overconfident in its incorrect predictions. The distribution of confidence levels for correct answers is highly concentrated at the upper end of the scale, while the distribution for incorrect answers is more spread out, indicating that the model is more likely to be uncertain when it makes mistakes. This suggests that the model could benefit from further training or calibration to improve its ability to accurately estimate its own uncertainty.