## Bar Chart: Model Performance by Confidence Level
### Overview
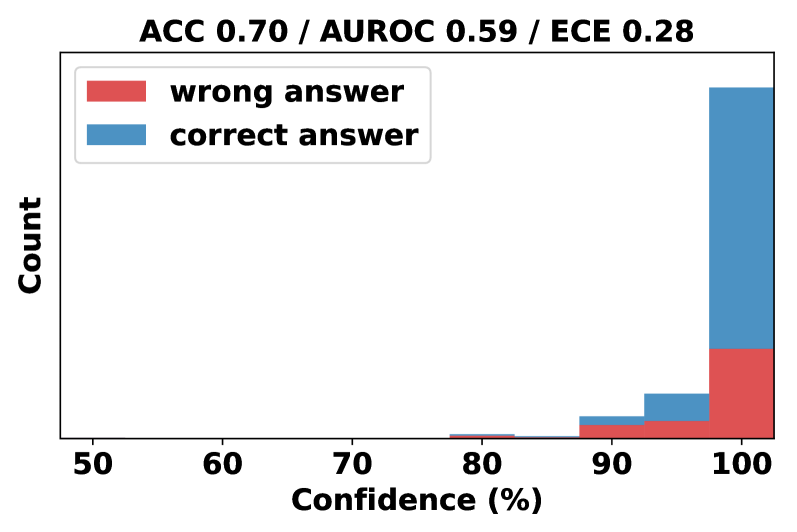
The chart visualizes the distribution of correct and incorrect answers across confidence levels (50–100%) for a classification model. The x-axis represents confidence percentages, while the y-axis shows the count of answers. Two data series are plotted: red bars for "wrong answers" and blue bars for "correct answers." The chart title includes three performance metrics: **ACC 0.70** (accuracy), **AUROC 0.59** (area under the ROC curve), and **ECE 0.28** (expected calibration error).
---
### Components/Axes
- **X-axis (Confidence %)**: Labeled "Confidence (%)" with tick marks at 50, 60, 70, 80, 90, and 100.
- **Y-axis (Count)**: Labeled "Count" with no explicit scale, but bar heights indicate relative frequency.
- **Legend**: Located in the top-left corner, with red representing "wrong answer" and blue representing "correct answer."
- **Title**: "ACC 0.70 / AUROC 0.59 / ECE 0.28" (top of the chart).
---
### Detailed Analysis
- **Confidence Levels**:
- **50–80%**: No bars are present, indicating zero counts for both correct and wrong answers.
- **90%**:
- **Correct answers (blue)**: A small bar (~5–10 units).
- **Wrong answers (red)**: A smaller bar (~2–3 units).
- **100%**:
- **Correct answers (blue)**: A tall bar (~30–40 units).
- **Wrong answers (red)**: A shorter bar (~15–20 units).
- **Metrics**:
- **ACC 0.70**: The model achieves 70% overall accuracy.
- **AUROC 0.59**: The model’s ability to distinguish between classes is slightly better than random (0.5), but performance is suboptimal.
- **ECE 0.28**: The model’s confidence is moderately miscalibrated (lower ECE values indicate better calibration).
---
### Key Observations
1. **High Confidence Dominates**:
- All data points are concentrated at **90% and 100% confidence**, suggesting the model rarely makes predictions with lower confidence.
- At **100% confidence**, correct answers dominate (blue bar is ~3x taller than red).
2. **Calibration Issues**:
- The **AUROC of 0.59** implies the model struggles to rank predictions effectively (closer to 0.5 = random).
- The **ECE of 0.28** indicates a mismatch between predicted confidence and actual accuracy (e.g., the model may be overconfident in some cases).
3. **Sparse Data**:
- No bars below 90% confidence suggest the model either avoids low-confidence predictions or the dataset excludes such cases.
---
### Interpretation
The chart reveals a model that performs well at high confidence levels (70% accuracy overall) but exhibits calibration issues. The **AUROC of 0.59** suggests the model’s predictions are not reliably discriminative, while the **ECE of 0.28** highlights a need for improved calibration (e.g., via temperature scaling or Platt scaling). The absence of data below 90% confidence may indicate a design choice to prioritize high-confidence predictions or a limitation in the model’s ability to handle uncertain cases.
The dominance of correct answers at 100% confidence aligns with the high accuracy (ACC 0.70), but the low AUROC implies the model’s confidence scores may not reflect true class separability. This discrepancy could lead to overreliance on the model in scenarios where uncertainty is critical.