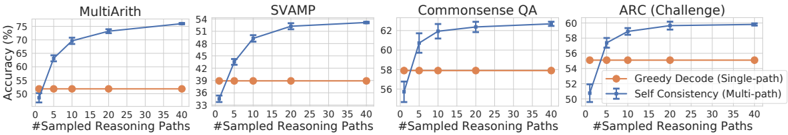
## Line Charts: Performance Comparison of Reasoning Methods
### Overview
The image contains four line charts comparing the performance of two reasoning methods, "Greedy Decode (Single-path)" and "Self Consistency (Multi-path)", across four different tasks: MultiArith, SVAMP, Commonsense QA, and ARC (Challenge). The x-axis represents the number of sampled reasoning paths, and the y-axis represents accuracy in percentage. Error bars are present on the "Self Consistency" data series.
### Components/Axes
* **Titles (Top of each chart):**
* Chart 1: MultiArith
* Chart 2: SVAMP
* Chart 3: Commonsense QA
* Chart 4: ARC (Challenge)
* **X-axis (All charts):**
* Label: "#Sampled Reasoning Paths"
* Ticks: 0, 5, 10, 15, 20, 25, 30, 35, 40
* **Y-axis (All charts):**
* Label: "Accuracy (%)"
* Chart 1 Ticks: 50, 55, 60, 65, 70, 75
* Chart 2 Ticks: 33, 36, 39, 42, 45, 48, 51, 54
* Chart 3 Ticks: 56, 58, 60, 62
* Chart 4 Ticks: 50, 52, 54, 56, 58, 60
* **Legend (Bottom-right of the last chart):**
* Orange Line: "Greedy Decode (Single-path)"
* Blue Line: "Self Consistency (Multi-path)"
### Detailed Analysis
**Chart 1: MultiArith**
* **Greedy Decode (Single-path) - Orange:** The line is approximately flat at around 51% accuracy.
* Data points: (0, ~51%), (10, ~51%), (20, ~51%), (40, ~51%)
* **Self Consistency (Multi-path) - Blue:** The line slopes upward, starting around 50% and reaching approximately 76%.
* Data points: (0, ~50%), (5, ~64%), (10, ~70%), (20, ~74%), (40, ~76%)
**Chart 2: SVAMP**
* **Greedy Decode (Single-path) - Orange:** The line is approximately flat at around 39% accuracy.
* Data points: (0, ~39%), (10, ~39%), (20, ~39%), (40, ~39%)
* **Self Consistency (Multi-path) - Blue:** The line slopes upward, starting around 34% and reaching approximately 53%.
* Data points: (0, ~34%), (5, ~43%), (10, ~49%), (20, ~52%), (40, ~53%)
**Chart 3: Commonsense QA**
* **Greedy Decode (Single-path) - Orange:** The line is approximately flat at around 58% accuracy.
* Data points: (0, ~58%), (5, ~58%), (10, ~58%), (20, ~58%), (40, ~58%)
* **Self Consistency (Multi-path) - Blue:** The line slopes upward, starting around 57% and reaching approximately 62%.
* Data points: (0, ~57%), (5, ~61%), (10, ~62%), (20, ~62%), (40, ~62%)
**Chart 4: ARC (Challenge)**
* **Greedy Decode (Single-path) - Orange:** The line is approximately flat at around 55% accuracy.
* Data points: (0, ~55%), (5, ~55%), (10, ~55%), (20, ~55%), (40, ~55%)
* **Self Consistency (Multi-path) - Blue:** The line slopes upward, starting around 50% and reaching approximately 60%.
* Data points: (0, ~50%), (5, ~57%), (10, ~59%), (20, ~60%), (40, ~60%)
### Key Observations
* In all four tasks, the "Self Consistency (Multi-path)" method (blue line) generally outperforms the "Greedy Decode (Single-path)" method (orange line), especially as the number of sampled reasoning paths increases.
* The "Greedy Decode (Single-path)" method shows a relatively flat performance across all tasks, regardless of the number of sampled reasoning paths.
* The "Self Consistency (Multi-path)" method shows the most significant improvement in accuracy on the MultiArith task.
* Error bars are present on the "Self Consistency" data series, indicating the variability in the results.
### Interpretation
The data suggests that using multiple reasoning paths ("Self Consistency") leads to better performance than using a single path ("Greedy Decode") for these tasks. The improvement is more pronounced for some tasks (e.g., MultiArith) than others. The flat performance of "Greedy Decode" indicates that simply sampling more paths without a consistency mechanism does not improve accuracy. The error bars on the "Self Consistency" data series suggest that the performance of this method can vary, possibly depending on the specific implementation or the nature of the task.