## Line Charts: Performance of Greedy Decode vs. Self Consistency Across Reasoning Tasks
### Overview
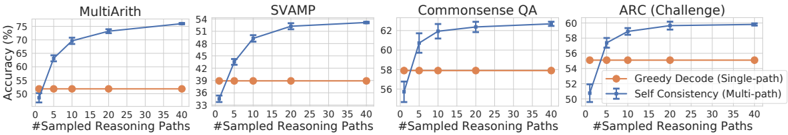
The image displays four separate line charts arranged horizontally, comparing the performance of two methods—"Greedy Decode (Single-path)" and "Self Consistency (Multi-path)"—across four different reasoning benchmarks. Each chart plots accuracy (in percentage) against the number of sampled reasoning paths.
### Components/Axes
* **Titles (Top of each chart, left to right):** `MultiArith`, `SVAMP`, `Commonsense QA`, `ARC (Challenge)`.
* **X-Axis (Common to all charts):** Label: `#Sampled Reasoning Paths`. Scale: Linear, with major tick marks at 0, 5, 10, 20, 30, and 40.
* **Y-Axis (Common label, different scales):** Label: `Accuracy (%)`. The scale range varies per chart to best fit the data.
* **Legend (Located in the bottom-right chart, `ARC (Challenge)`):**
* Orange line with circle markers: `Greedy Decode (Single-path)`
* Blue line with circle markers: `Self Consistency (Multi-path)`
* **Data Series:** Each chart contains two lines corresponding to the legend. The orange line is consistently flat. The blue line shows an upward trend that plateaus.
### Detailed Analysis
**Chart 1: MultiArith**
* **Y-Axis Scale:** 50% to 75%.
* **Greedy Decode (Orange):** Appears constant at approximately **50%** across all path counts (0 to 40).
* **Self Consistency (Blue):** Shows a steep initial increase.
* At 0 paths: ~50%
* At 5 paths: ~70%
* At 10 paths: ~72%
* At 20 paths: ~74%
* At 40 paths: ~75%
* **Trend:** Sharp improvement from 0 to 5 paths, followed by gradual, diminishing gains.
**Chart 2: SVAMP**
* **Y-Axis Scale:** 33% to 54%.
* **Greedy Decode (Orange):** Appears constant at approximately **39%**.
* **Self Consistency (Blue):**
* At 0 paths: ~33%
* At 5 paths: ~42%
* At 10 paths: ~48%
* At 20 paths: ~51%
* At 40 paths: ~54%
* **Trend:** Consistent upward slope, with the most significant gain between 0 and 10 paths.
**Chart 3: Commonsense QA**
* **Y-Axis Scale:** 56% to 62%.
* **Greedy Decode (Orange):** Appears constant at approximately **58%**.
* **Self Consistency (Blue):**
* At 0 paths: ~56%
* At 5 paths: ~61%
* At 10 paths: ~62%
* At 20 paths: ~62.5%
* At 40 paths: ~63%
* **Trend:** Rapid rise to near-peak performance by 5 paths, with very minimal improvement thereafter.
**Chart 4: ARC (Challenge)**
* **Y-Axis Scale:** 50% to 60%.
* **Greedy Decode (Orange):** Appears constant at approximately **56%**.
* **Self Consistency (Blue):**
* At 0 paths: ~50%
* At 5 paths: ~58%
* At 10 paths: ~59%
* At 20 paths: ~60%
* At 40 paths: ~60%
* **Trend:** Sharp increase to 5 paths, then plateaus at ~60% from 20 paths onward.
### Key Observations
1. **Universal Superiority of Multi-Path:** In all four tasks, the "Self Consistency (Multi-path)" method (blue line) achieves higher accuracy than the "Greedy Decode (Single-path)" method (orange line) once any reasoning paths are sampled (i.e., for x > 0).
2. **Flat Baseline:** The performance of Greedy Decode is invariant to the number of sampled reasoning paths, as expected for a single-path method. It serves as a constant baseline.
3. **Diminishing Returns:** The most substantial accuracy gains for Self Consistency occur within the first 5-10 sampled paths. Beyond 20 paths, the improvement curve flattens significantly across all tasks.
4. **Task-Dependent Gains:** The absolute improvement from using Self Consistency varies by task. The largest gains are seen in `MultiArith` (~25 percentage points) and `SVAMP` (~21 points), while the gains are more modest in `Commonsense QA` (~5 points) and `ARC (Challenge)` (~4 points).
### Interpretation
This set of charts provides strong empirical evidence for the effectiveness of the "Self Consistency" decoding strategy over standard greedy decoding for complex reasoning tasks. The core insight is that **aggregating the final answer from multiple, independently sampled reasoning paths (multi-path) leads to more robust and accurate results than relying on a single, likely greedy, path.**
The data suggests a clear cost-benefit relationship: a small amount of additional computation (sampling 5-10 paths) yields a large performance boost. However, the returns diminish rapidly, indicating an optimal operating point likely exists between 10 and 20 paths for these tasks, balancing accuracy against computational cost. The consistent pattern across four diverse benchmarks (arithmetic, word problems, commonsense, and scientific reasoning) implies that this is a generalizable technique for improving the reliability of language model reasoning. The flat orange line underscores that simply repeating the single-path method does not improve performance; the diversity of reasoning paths is the critical factor.