## Scatter Plot with Inset Zoom: Law School Admissions
### Overview
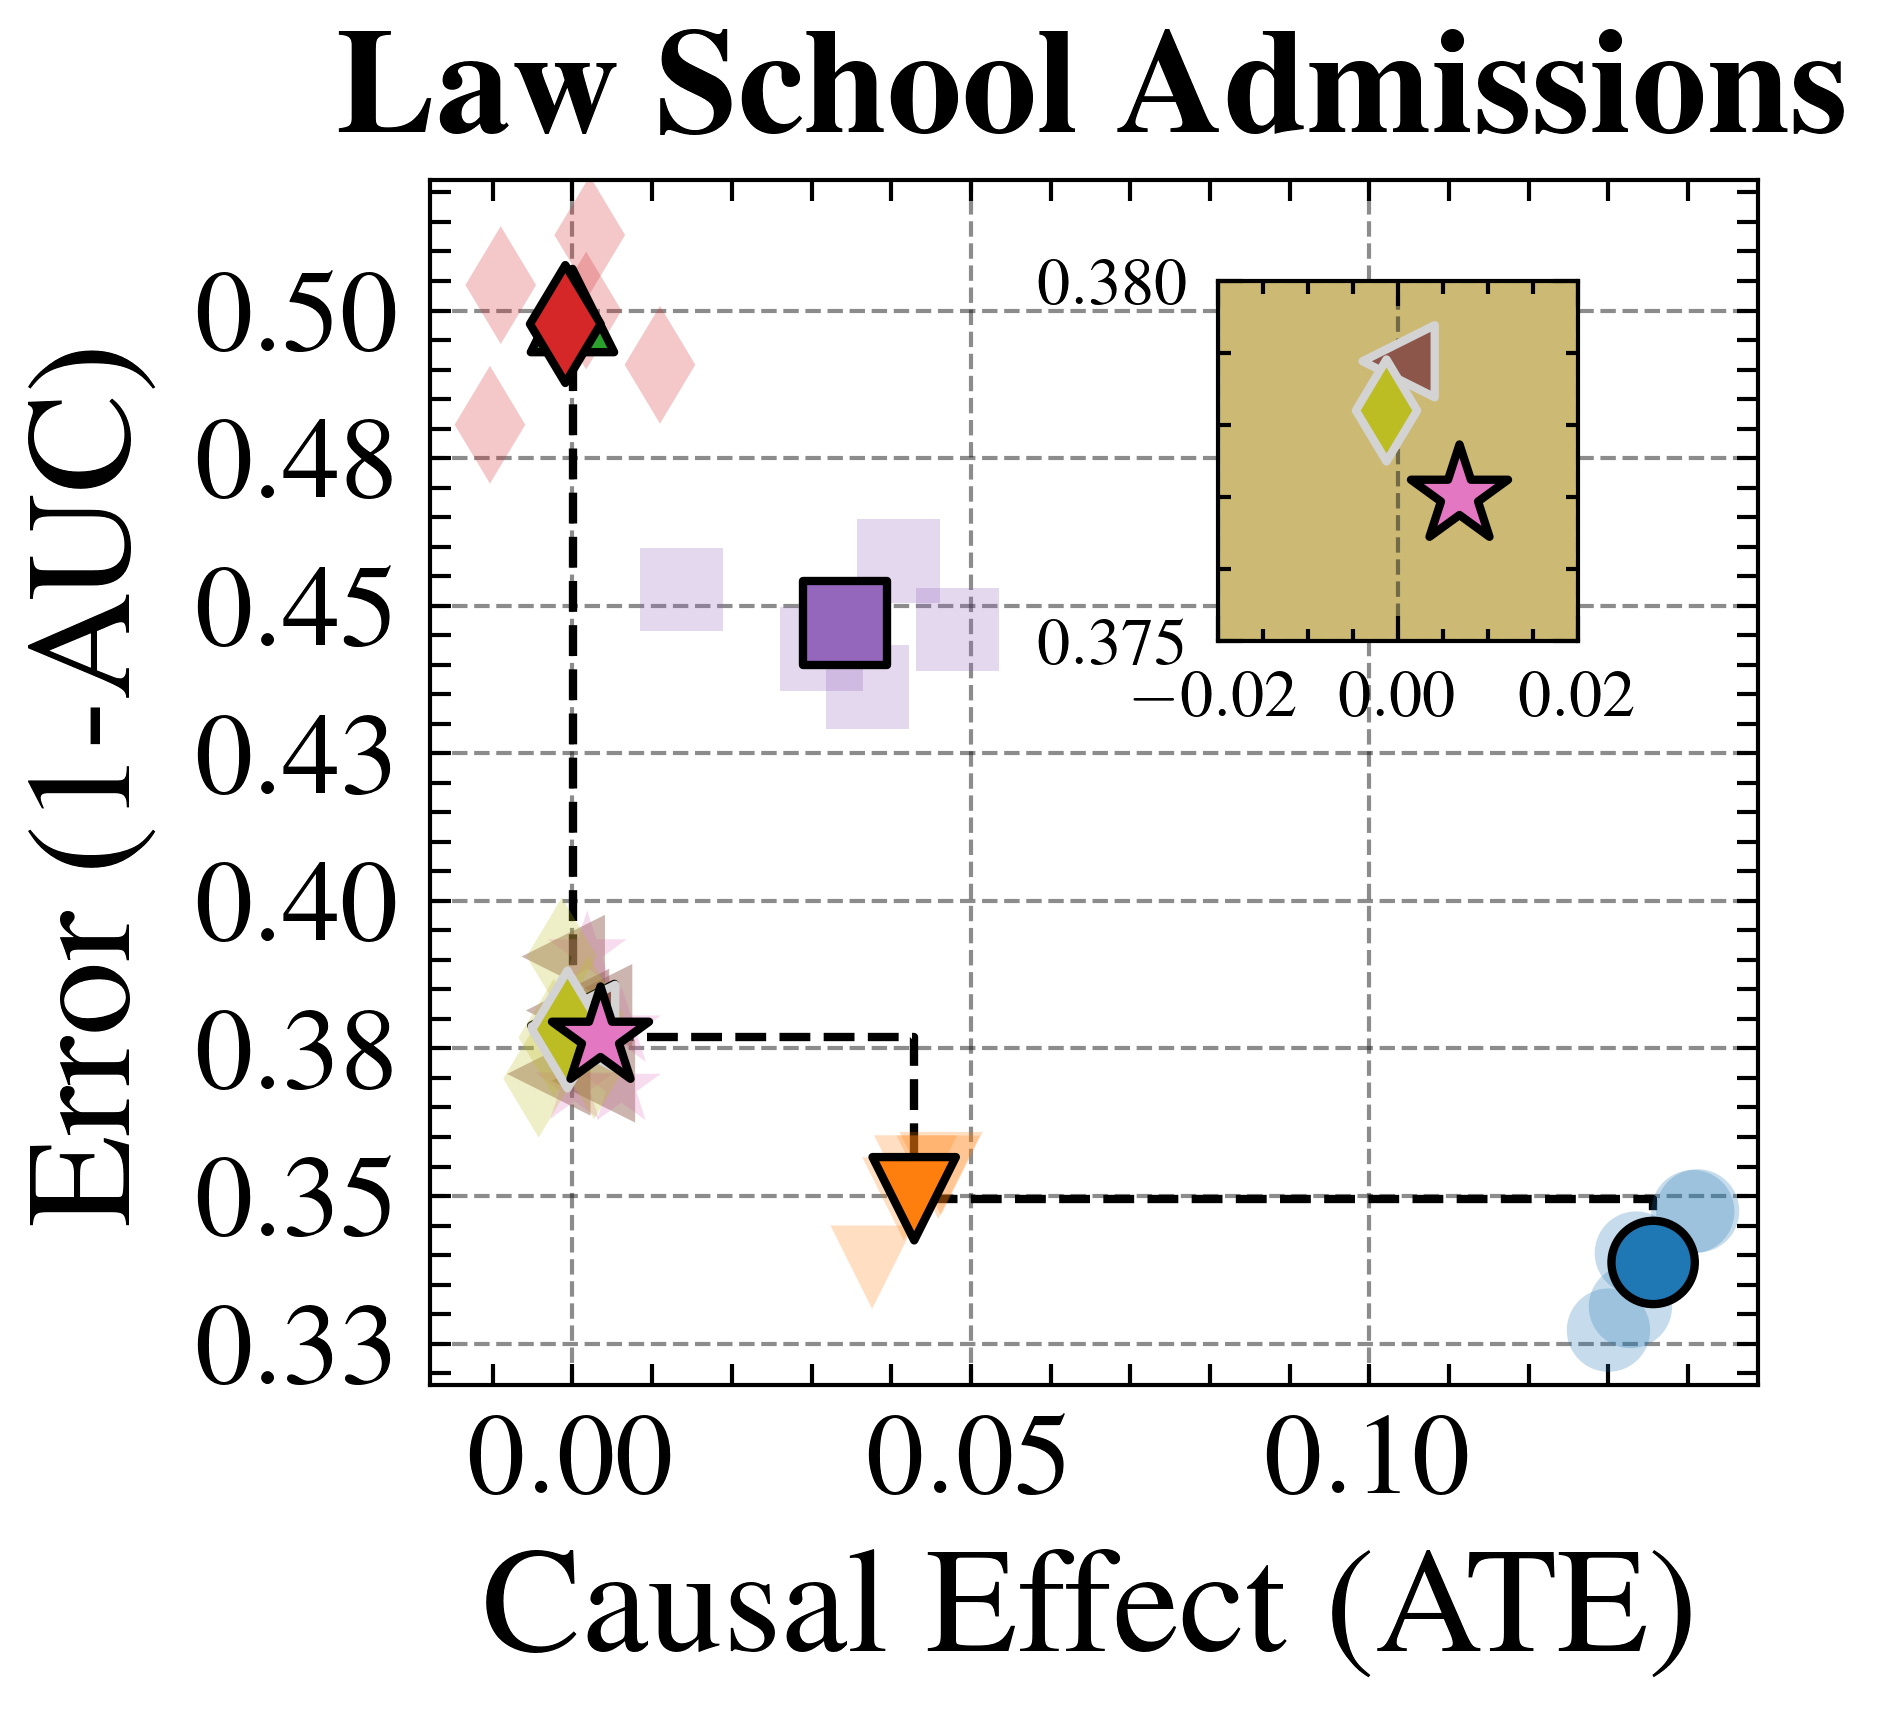
The image is a scatter plot titled "Law School Admissions." It visualizes the relationship between two metrics: "Causal Effect (ATE)" on the x-axis and "Error (1-AUC)" on the y-axis. The plot contains multiple data points represented by distinct shapes and colors, some connected by dashed lines. An inset plot in the upper-right quadrant provides a zoomed-in view of a specific cluster of points.
### Components/Axes
* **Main Plot Title:** "Law School Admissions" (centered at the top).
* **X-Axis:**
* **Label:** "Causal Effect (ATE)"
* **Scale:** Linear, ranging from approximately 0.00 to 0.10.
* **Major Tick Marks:** 0.00, 0.05, 0.10.
* **Y-Axis:**
* **Label:** "Error (1-AUC)"
* **Scale:** Linear, ranging from approximately 0.33 to 0.50.
* **Major Tick Marks:** 0.33, 0.35, 0.38, 0.40, 0.43, 0.45, 0.48, 0.50.
* **Inset Plot (Upper-Right):**
* A smaller square plot with a tan background.
* **X-Axis:** Range approximately -0.02 to 0.02. Major ticks at -0.02, 0.00, 0.02.
* **Y-Axis:** Range approximately 0.375 to 0.380. Major ticks at 0.375, 0.380.
* Contains three data points: a pink star, a yellow diamond, and a brown triangle.
* **Data Series (Markers):** The plot uses distinct shapes and colors to represent different categories or methods. A legend is not explicitly shown, so identification is based on visual markers.
1. **Red Diamond:** Located at the top-left of the main plot.
2. **Purple Square:** Located in the upper-middle region.
3. **Pink Star:** Located in the lower-left region. A dashed line connects it to the orange triangle.
4. **Orange Triangle (pointing down):** Located in the lower-middle region. A dashed line connects it to the blue circle.
5. **Blue Circle:** Located at the bottom-right of the main plot.
6. **Yellow Diamond:** Located very close to the pink star in the lower-left. Also appears in the inset.
7. **Brown Triangle (pointing right):** Appears only in the inset plot.
* **Connecting Lines:** Dashed black lines connect the Pink Star to the Orange Triangle, and the Orange Triangle to the Blue Circle, suggesting a sequence or comparison.
### Detailed Analysis
* **Data Point Approximate Coordinates (Main Plot):**
* **Red Diamond:** Causal Effect (ATE) ≈ 0.00, Error (1-AUC) ≈ 0.50.
* **Purple Square:** Causal Effect (ATE) ≈ 0.04, Error (1-AUC) ≈ 0.45.
* **Pink Star:** Causal Effect (ATE) ≈ 0.00, Error (1-AUC) ≈ 0.38.
* **Yellow Diamond:** Causal Effect (ATE) ≈ 0.00, Error (1-AUC) ≈ 0.38 (slightly left/below the Pink Star).
* **Orange Triangle:** Causal Effect (ATE) ≈ 0.05, Error (1-AUC) ≈ 0.35.
* **Blue Circle:** Causal Effect (ATE) ≈ 0.10, Error (1-AUC) ≈ 0.33.
* **Data Point Approximate Coordinates (Inset Plot):**
* **Pink Star:** Causal Effect (ATE) ≈ 0.01, Error (1-AUC) ≈ 0.377.
* **Yellow Diamond:** Causal Effect (ATE) ≈ 0.00, Error (1-AUC) ≈ 0.378.
* **Brown Triangle:** Causal Effect (ATE) ≈ 0.00, Error (1-AUC) ≈ 0.379.
* **Trend Verification:**
* The dashed line from the **Pink Star** (low ATE, moderate Error) to the **Orange Triangle** (moderate ATE, lower Error) slopes downward to the right, indicating a decrease in error as causal effect increases along this path.
* The dashed line from the **Orange Triangle** to the **Blue Circle** (high ATE, lowest Error) continues this downward-right slope, reinforcing the trend of decreasing error with increasing causal effect for this series.
* The **Red Diamond** and **Purple Square** are isolated points with higher error values. The **Red Diamond** has near-zero causal effect but the highest error.
### Key Observations
1. **Trade-off Visualization:** The plot suggests a potential trade-off or relationship where methods achieving a higher Causal Effect (ATE) tend to have a lower Error (1-AUC), as seen in the connected series (Pink Star -> Orange Triangle -> Blue Circle).
2. **Cluster at Low ATE:** Several points (Red Diamond, Pink Star, Yellow Diamond) are clustered near a Causal Effect of 0.00, but with vastly different error rates (from ~0.38 to ~0.50).
3. **Inset Highlight:** The inset zooms in on the cluster near (0.00, 0.38), revealing that the Pink Star, Yellow Diamond, and Brown Triangle are very close in both metrics, with differences in the third decimal place for Error.
4. **Outlier:** The **Red Diamond** is a clear outlier with the highest error (0.50) despite having a near-zero causal effect.
### Interpretation
This chart likely compares different algorithmic models or policy interventions in the context of law school admissions. The metrics suggest a dual evaluation:
* **Causal Effect (ATE - Average Treatment Effect):** Measures the estimated impact of an intervention (e.g., using a specific admissions model) on an outcome.
* **Error (1-AUC):** Measures the predictive inaccuracy of the model. A lower value is better.
The data demonstrates that not all methods are equal. The connected path (Pink Star -> Orange Triangle -> Blue Circle) may represent a family of related models or a tuning process where increasing the model's causal effect estimate is associated with improved predictive accuracy (lower error). The **Blue Circle** method appears most favorable, achieving the highest causal effect and lowest error.
Conversely, the **Red Diamond** method performs poorly, with high error and negligible causal effect. The cluster near zero ATE (including the inset points) represents methods that have little to no estimated causal impact but vary significantly in their baseline predictive error. The inset emphasizes that even among these low-impact methods, fine-grained differences exist.
**Overall Implication:** The chart argues for the importance of considering both causal impact and predictive error when evaluating admissions models. It visually identifies a promising direction (increasing ATE while decreasing error) and highlights underperforming or neutral alternatives. The absence of a formal legend suggests the audience is expected to recognize the methods by their markers, indicating this is likely from a specialized technical paper or report.