## Scatter Plot: Law School Admissions
### Overview
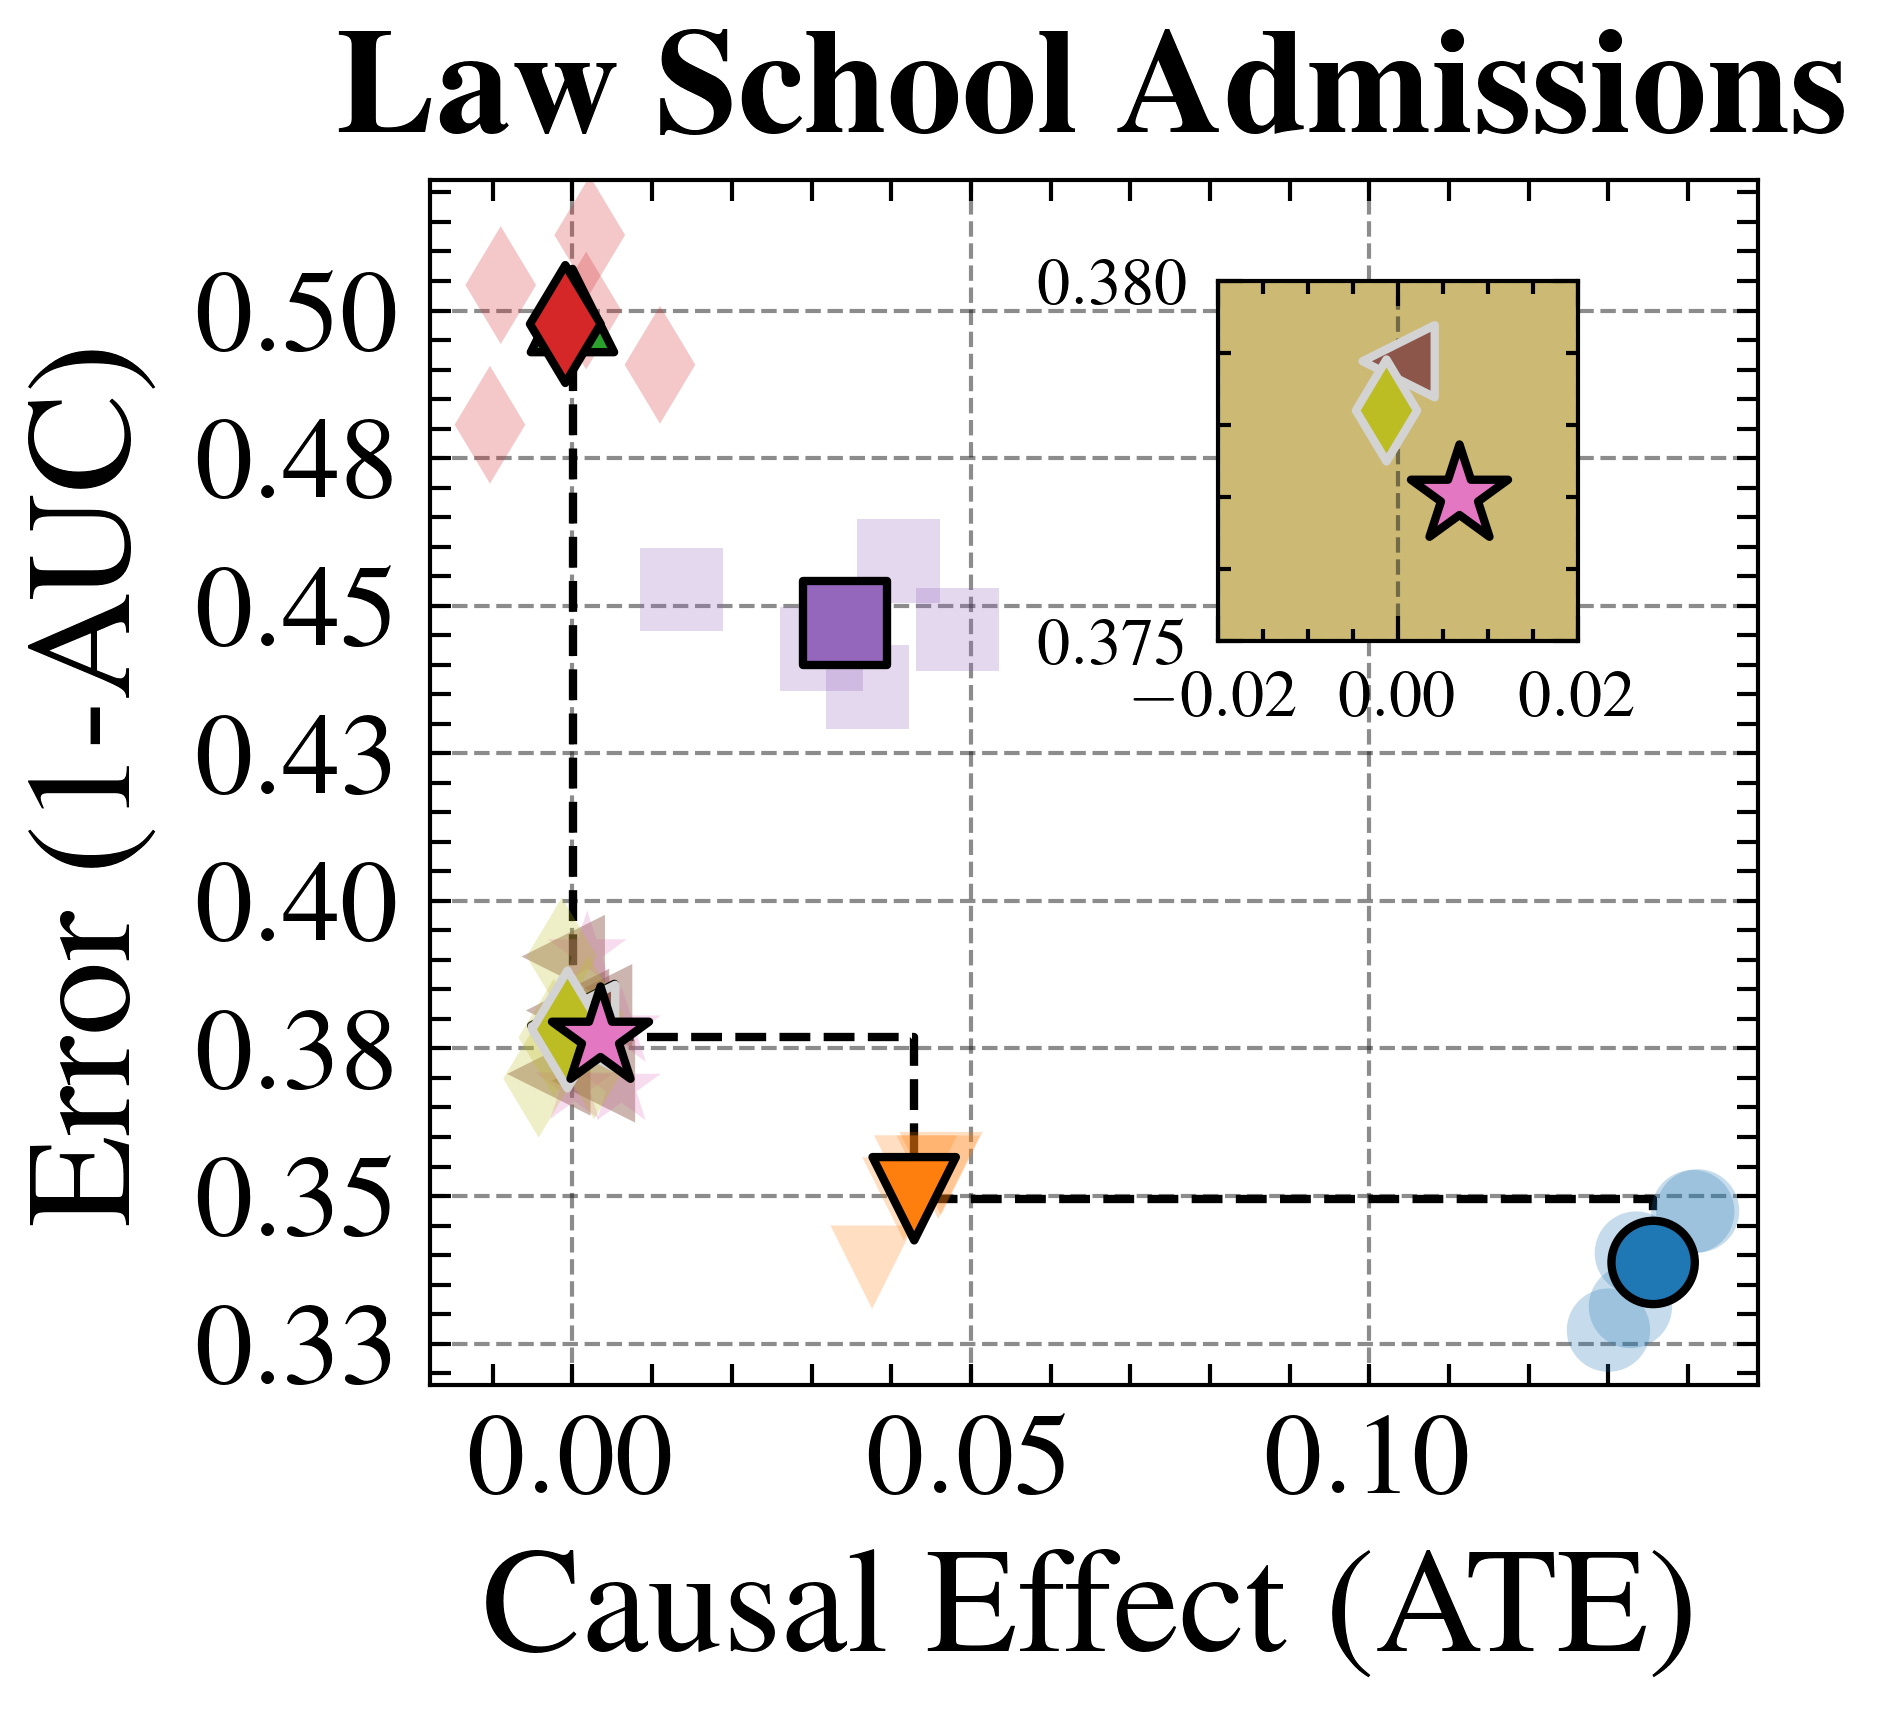
The image is a scatter plot titled "Law School Admissions," visualizing the relationship between **Causal Effect (ATE)** and **Error (1-AUC)**. Data points are color-coded and shaped to represent different admission factors (e.g., GPA, LSAT). An inset box plot in the top-right corner provides additional distributional insights.
---
### Components/Axes
- **Y-Axis (Error (1-AUC))**: Ranges from 0.33 to 0.50, labeled with increments of 0.01.
- **X-Axis (Causal Effect (ATE))**: Ranges from 0.00 to 0.10, labeled with increments of 0.01.
- **Legend**: Located in the top-right corner, mapping colors/shapes to categories:
- Red diamond: GPA
- Purple square: LSAT
- Yellow triangle: Undergrad Major
- Blue circle: Extracurriculars
- Orange triangle: Letters of Recommendation
- Pink star: Other
---
### Detailed Analysis
#### Main Scatter Plot
- **Data Points**:
- **GPA (Red Diamond)**: Positioned at (0.00, 0.49), indicating the highest error (1-AUC) and lowest causal effect.
- **LSAT (Purple Square)**: At (0.05, 0.45), showing moderate error and causal effect.
- **Undergrad Major (Yellow Triangle)**: Clustered near (0.03, 0.38–0.40), with moderate error and low-to-moderate causal effect.
- **Extracurriculars (Blue Circle)**: Spread between (0.08–0.10, 0.33–0.35), suggesting low error and higher causal effect.
- **Letters of Recommendation (Orange Triangle)**: At (0.04, 0.36), low error and moderate causal effect.
- **Other (Pink Star)**: At (0.07, 0.38), moderate error and causal effect.
- **Trends**:
- Higher error (1-AUC) correlates with lower causal effect (ATE) for most categories (e.g., GPA, LSAT).
- Extracurriculars and Letters of Recommendation show lower error but higher causal effect.
#### Inset Box Plot
- **Median**: 0.375 (horizontal line).
- **Range**: Whiskers extend from -0.02 to 0.02.
- **Outliers**: A single outlier at 0.380 (marked with a star).
- **Distribution**: Symmetric around the median, with most values clustered near 0.375.
---
### Key Observations
1. **GPA** has the highest error (0.49) and lowest causal effect (0.00), suggesting it is the least reliable predictor.
2. **Extracurriculars** and **Letters of Recommendation** exhibit the lowest error (0.33–0.36) and higher causal effects (0.04–0.10), indicating stronger predictive power.
3. The inset box plot reveals variability in causal effects, with most values near 0.375 but a notable outlier at 0.380.
---
### Interpretation
The plot demonstrates that **non-academic factors** (e.g., Extracurriculars, Letters of Recommendation) are more reliable predictors of law school admissions outcomes compared to academic metrics like GPA. The inverse relationship between error and causal effect highlights the trade-off between model accuracy and interpretability. The box plot’s outlier at 0.380 suggests an exceptional case, potentially warranting further investigation.
The legend’s spatial placement (top-right) ensures clarity, while the scatter plot’s color/shape coding enables easy differentiation of factors. The inset box plot contextualizes the main data, emphasizing distributional patterns.