\n
## Diagram: System Architecture for Viewpoint Generation and Verification
### Overview
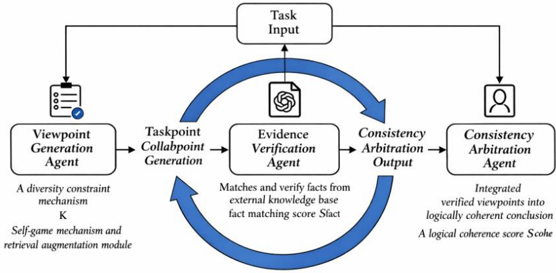
The image depicts a system architecture diagram illustrating a process for generating, verifying, and arbitrating viewpoints. The diagram shows a cyclical flow between several agents and a central evidence verification component. The overall process appears to be designed for creating logically coherent conclusions from task inputs.
### Components/Axes
The diagram consists of the following components:
* **Task Input:** Located at the top-center of the diagram, serving as the starting point for the process.
* **Viewpoint Generation Agent:** Positioned on the left side, with text describing "A diversity constraint mechanism" and "Self-game mechanism and retrieval augmentation module" below it. It has a small icon resembling a checklist.
* **Taskpoint Collaboration Generation:** A connecting box between the Viewpoint Generation Agent and the Evidence Verification Agent.
* **Evidence Verification Agent:** Located in the center, containing an icon resembling a document with a spiral. Text within the box states: "Matches and verify facts from external knowledge base fact matching score Sfact".
* **Consistency Arbitration Output:** Positioned to the right of the Evidence Verification Agent.
* **Consistency Arbitration Agent:** Located on the far right, with a human icon. Text below it states: "Integrated verified viewpoints into logically coherent conclusion. A logical coherence score Scohe".
* **Cyclical Arrows:** Large blue arrows indicate the flow of information between the agents, forming a loop.
### Detailed Analysis or Content Details
The diagram illustrates a cyclical process:
1. **Task Input** initiates the process.
2. The **Task Input** feeds into the **Viewpoint Generation Agent**, which generates viewpoints based on diversity constraints and self-game mechanisms.
3. The **Viewpoint Generation Agent** passes the viewpoints to **Taskpoint Collaboration Generation**.
4. **Taskpoint Collaboration Generation** passes the viewpoints to the **Evidence Verification Agent**.
5. The **Evidence Verification Agent** verifies facts against an external knowledge base, producing a "fact matching score" (Sfact).
6. The verified evidence is passed to **Consistency Arbitration Output**.
7. **Consistency Arbitration Output** passes the information to the **Consistency Arbitration Agent**.
8. The **Consistency Arbitration Agent** integrates the verified viewpoints into a logically coherent conclusion, generating a "logical coherence score" (Scohe).
9. The process then loops back to the **Evidence Verification Agent** via a blue arrow originating from the **Consistency Arbitration Agent**.
The diagram also includes the following textual elements:
* "A diversity constraint mechanism"
* "Self-game mechanism and retrieval augmentation module"
* "Matches and verify facts from external knowledge base fact matching score Sfact"
* "Integrated verified viewpoints into logically coherent conclusion. A logical coherence score Scohe"
### Key Observations
The diagram emphasizes a cyclical process of viewpoint generation, verification, and arbitration. The inclusion of scores (Sfact and Scohe) suggests a quantitative evaluation of the process's effectiveness. The use of "agents" implies a modular and potentially automated system.
### Interpretation
The diagram represents a system designed to produce reliable and logically sound conclusions from initial task inputs. The cyclical nature of the process suggests an iterative refinement of viewpoints based on evidence verification and consistency checks. The "diversity constraint mechanism" and "self-game mechanism" within the Viewpoint Generation Agent likely aim to explore a wide range of perspectives and challenge assumptions. The scores (Sfact and Scohe) provide metrics for assessing the quality of the evidence and the coherence of the final conclusion. The system appears to be geared towards applications where objective and well-supported conclusions are critical, such as knowledge discovery, decision-making, or automated reasoning. The diagram does not provide specific data or numerical values, but rather illustrates the architecture and flow of information within the system.