## Time Series Chart: Activity Recognition Signals
### Overview
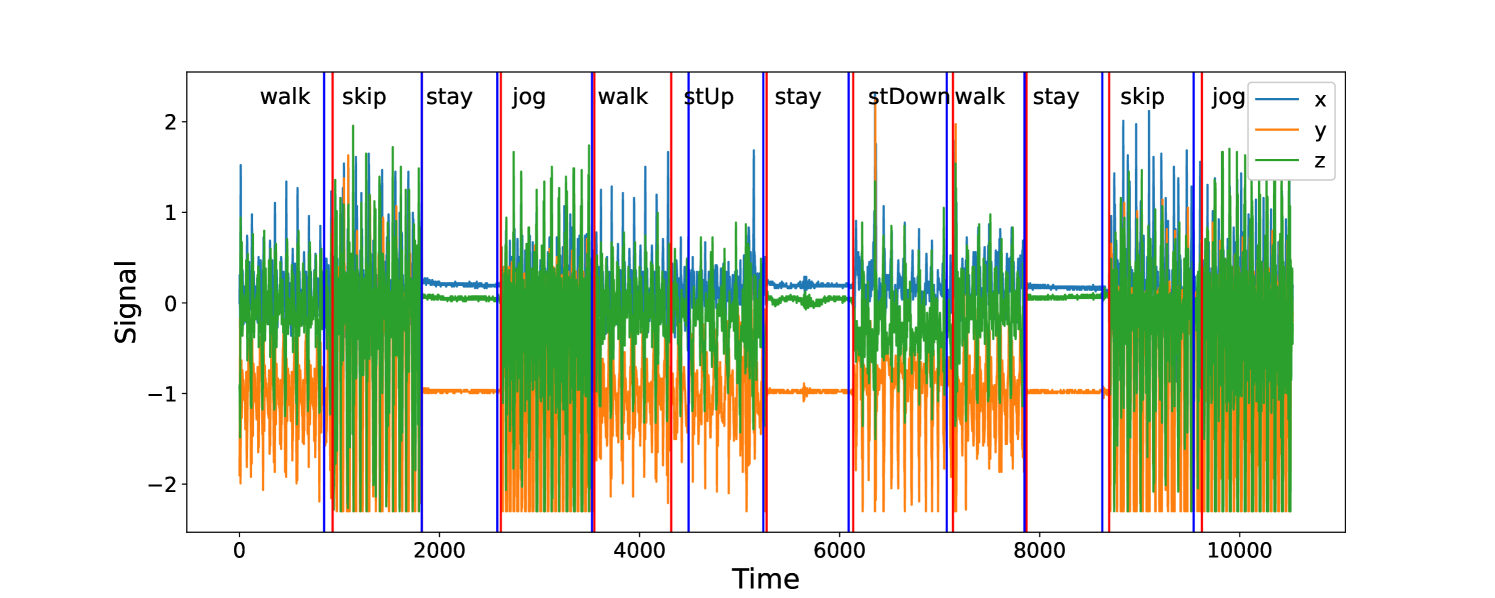
The image is a time series chart displaying signal data from three axes (x, y, z) over a period of time, with different activities labeled along the x-axis. The chart shows how the signal values change during various activities like walking, skipping, staying, jogging, and stair climbing. Vertical lines mark the transitions between these activities.
### Components/Axes
* **X-axis:** Represents time, ranging from 0 to 10000. Axis markers are present at 0, 2000, 4000, 6000, 8000, and 10000.
* **Y-axis:** Represents the signal value, ranging from -2 to 2. Axis markers are present at -2, -1, 0, 1, and 2.
* **Data Series:**
* **x (blue):** Varies between approximately 0 and 1.8 during active periods and remains relatively constant around 0.3 during "stay" periods.
* **y (orange):** Varies between approximately -2.2 and 0.2 during active periods and remains relatively constant around -1 during "stay" periods.
* **z (green):** Varies between approximately -0.8 and 1.5 during active periods and remains relatively constant around 0.2 during "stay" periods.
* **Legend:** Located in the top-right corner, indicating the color-coded axes:
* Blue: x
* Orange: y
* Green: z
* **Activity Labels:** Placed above the chart, indicating the activity performed during that time interval. The activities are: walk, skip, stay, jog, walk, stUp (stair up), stay, stDown (stair down), walk, stay, skip, jog.
* **Vertical Lines:** Blue vertical lines separate the different activities. Red vertical lines appear to mark the end of "skip" and "stUp" activities.
### Detailed Analysis
* **Walk:** The "walk" segments show moderate fluctuations in all three axes (x, y, z). The x-axis (blue) varies between 0 and 1.8, the y-axis (orange) varies between -2.2 and 0.2, and the z-axis (green) varies between -0.8 and 1.5.
* **Skip:** The "skip" segments show high-frequency fluctuations in all three axes. The x-axis (blue) varies between 0 and 1.8, the y-axis (orange) varies between -2.2 and 0.2, and the z-axis (green) varies between -0.8 and 1.5.
* **Stay:** The "stay" segments show relatively constant values for all three axes. The x-axis (blue) remains around 0.3, the y-axis (orange) remains around -1, and the z-axis (green) remains around 0.2.
* **Jog:** The "jog" segments show high-frequency fluctuations in all three axes, similar to the "skip" segments. The x-axis (blue) varies between 0 and 1.8, the y-axis (orange) varies between -2.2 and 0.2, and the z-axis (green) varies between -0.8 and 1.5.
* **stUp (Stair Up):** The "stUp" segment shows a distinct pattern, with the y-axis (orange) showing a sharp increase. The x-axis (blue) varies between 0 and 1.8, the y-axis (orange) varies between -2.2 and 0.2, and the z-axis (green) varies between -0.8 and 1.5.
* **stDown (Stair Down):** The "stDown" segment shows a distinct pattern, with the y-axis (orange) showing a sharp decrease. The x-axis (blue) varies between 0 and 1.8, the y-axis (orange) varies between -2.2 and 0.2, and the z-axis (green) varies between -0.8 and 1.5.
### Key Observations
* The "stay" activity is easily distinguishable from other activities due to the relatively constant signal values.
* "Skip" and "Jog" activities have similar signal patterns, characterized by high-frequency fluctuations.
* "stUp" and "stDown" activities show distinct patterns in the y-axis (orange), indicating changes in vertical movement.
* The x-axis (blue) and z-axis (green) show similar patterns during "walk", "skip", and "jog" activities.
### Interpretation
The chart demonstrates how different activities can be recognized based on the signal data from the x, y, and z axes. The "stay" activity serves as a baseline, while the other activities show distinct patterns of fluctuation. The "stUp" and "stDown" activities highlight the importance of the y-axis in detecting vertical movements. The similarity between "skip" and "jog" suggests that additional features or analysis might be needed to differentiate these activities. The data suggests that a combination of signal amplitude and frequency can be used to classify different human activities.