\n
## Time Series Chart: Activity Signal Over Time
### Overview
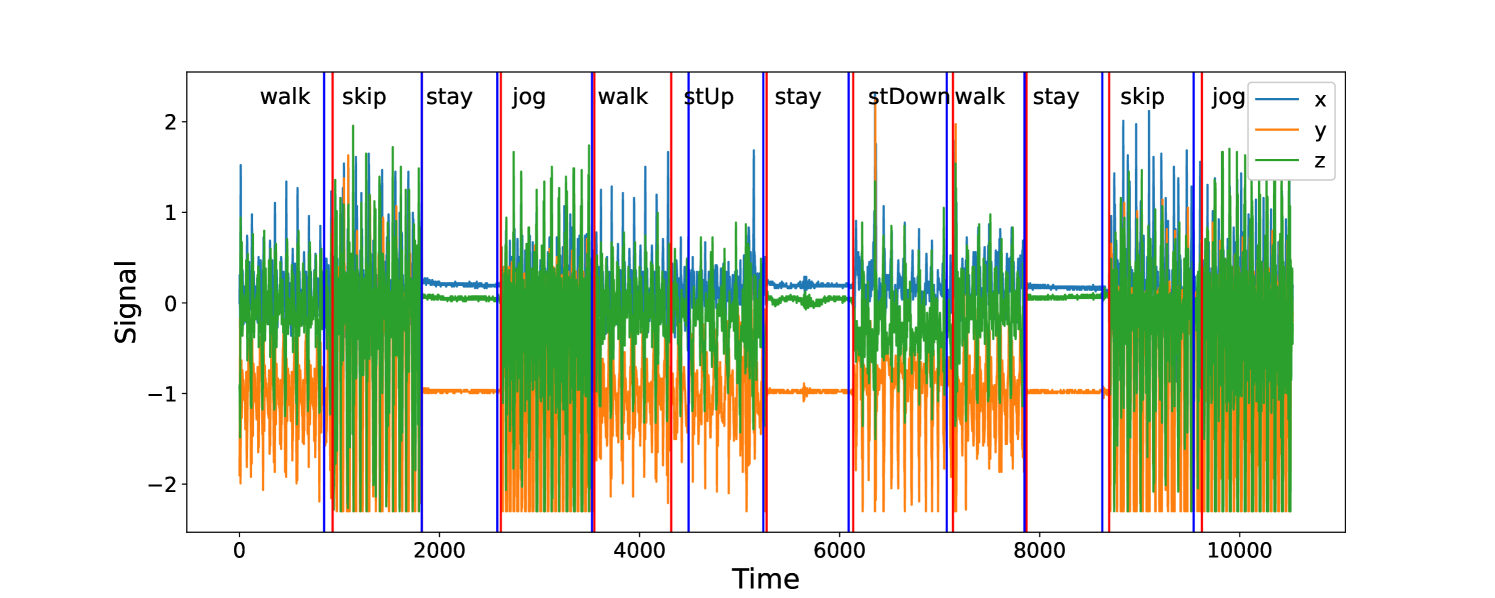
The image presents a time series chart displaying signal strength across three axes (x, y, and z) over time, with annotations indicating different activities performed during the recording. The chart appears to represent sensor data, likely from an accelerometer or similar device, capturing movement patterns. The x-axis represents time, and the y-axis represents signal strength.
### Components/Axes
* **X-axis:** Time (units not specified, ranging from approximately 0 to 11000)
* **Y-axis:** Signal (units not specified, ranging from approximately -2 to 2)
* **Legend (top-right):**
* x (Blue line)
* y (Orange line)
* z (Green line)
* **Activity Annotations (top-center):**
* walk
* skip
* stay
* jog
* stUp (likely "step up")
* stay
* stDown (likely "step down")
* walk
* stay
* skip
* jog
### Detailed Analysis
The chart shows three distinct lines representing the signal from the x, y, and z axes. Each line fluctuates over time, and the amplitude of these fluctuations varies depending on the activity being performed. Vertical lines mark the beginning and end of each activity.
* **Walk (0-1500, 3500-5000, 7500-8500):** During walking, all three axes show relatively consistent, moderate fluctuations. The x and z axes exhibit larger amplitude oscillations than the y axis.
* **Skip (1500-2500, 9000-10000):** Skipping is characterized by high-amplitude oscillations across all three axes, particularly the z-axis. The signal is more erratic and less consistent than during walking.
* **Stay (2500-3500, 5000-6000, 8500-9000):** When staying still, the signal across all axes is relatively low and stable, with minimal fluctuations. The y-axis shows the least amount of movement.
* **Jog (3500-4500, 10000-11000):** Jogging exhibits moderate to high amplitude oscillations, similar to walking but with a slightly higher frequency and more pronounced peaks.
* **stUp (5000-6000):** The signal shows a quick increase in amplitude across all axes, followed by a return to a more stable state.
* **stDown (6000-7500):** The signal shows a quick decrease in amplitude across all axes, followed by a return to a more stable state.
**Approximate Signal Values (based on visual estimation):**
| Activity | Time Range | x-axis (approx. range) | y-axis (approx. range) | z-axis (approx. range) |
|---|---|---|---|---|
| Walk | 0-1500 | -1.5 to 1.5 | -0.5 to 0.5 | -1.8 to 1.8 |
| Skip | 1500-2500 | -2 to 2 | -1.5 to 1.5 | -2 to 2 |
| Stay | 2500-3500 | -0.2 to 0.2 | -0.1 to 0.1 | -0.3 to 0.3 |
| Jog | 3500-4500 | -1.2 to 1.2 | -0.4 to 0.4 | -1.5 to 1.5 |
| stUp | 5000-6000 | -1.5 to 1.5 | -0.5 to 0.5 | -1.8 to 1.8 |
| stDown | 6000-7500 | -1.5 to 1.5 | -0.5 to 0.5 | -1.8 to 1.8 |
### Key Observations
* The z-axis consistently shows the largest amplitude fluctuations across most activities, suggesting it is the most sensitive to movement.
* The y-axis generally exhibits the smallest amplitude fluctuations, indicating it is the least sensitive to movement.
* The "stay" activity shows minimal signal variation, providing a baseline for comparison.
* The "skip" activity generates the most dynamic signal, with the highest amplitude and frequency of oscillations.
* The "stUp" and "stDown" activities show a transient increase and decrease in signal, respectively.
### Interpretation
This chart demonstrates how sensor data can be used to identify and differentiate between various human activities. The distinct signal patterns observed for each activity suggest that machine learning algorithms could be trained to automatically recognize these activities based on the sensor data. The differences in signal amplitude and frequency across the x, y, and z axes provide valuable information about the type and intensity of movement. The "stay" activity serves as a control, allowing for the identification of baseline noise levels. The transient signals during "stUp" and "stDown" likely represent the initial acceleration and deceleration phases of stepping. The data suggests a clear correlation between activity type and signal characteristics, which could be leveraged for applications such as activity recognition, fall detection, and fitness tracking.