# Technical Document Extraction: Line Graph Analysis
## 1. **Axis Labels and Markers**
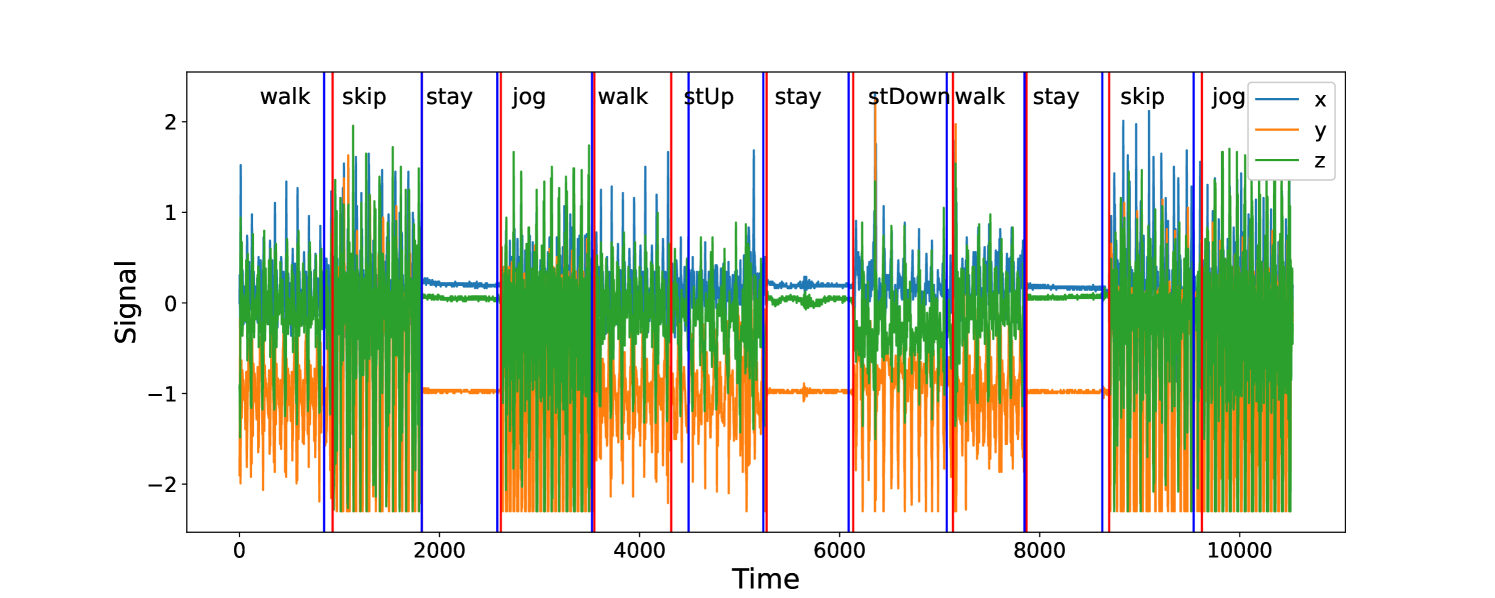
- **X-Axis (Horizontal):**
- Label: `Time`
- Markers: `0`, `2000`, `4000`, `6000`, `8000`, `10000`
- **Y-Axis (Vertical):**
- Label: `Signal`
- Range: `-2` to `2`
## 2. **Legend**
- **Location:** Top-right corner of the graph.
- **Labels and Colors:**
- `x` (Blue line)
- `y` (Orange line)
- `z` (Green line)
## 3. **Segment Labels and Boundaries**
Vertical red/blue lines divide the graph into labeled segments. Each segment corresponds to a specific action and time range:
| Segment Label | Time Range (X-axis) |
|---------------|---------------------|
| `walk` | `0` – `1000` |
| `skip` | `1000` – `2000` |
| `stay` | `2000` – `3000` |
| `jog` | `3000` – `4000` |
| `walk` | `4000` – `5000` |
| `stUp` | `5000` – `6000` |
| `stay` | `6000` – `7000` |
| `stDown` | `7000` – `8000` |
| `walk` | `8000` – `9000` |
| `stay` | `9000` – `10000` |
| `skip` | `10000` – `11000` |
| `jog` | `11000` – `12000` |
## 4. **Key Trends and Data Patterns**
### **X-Axis (Blue Line)**
- **Trend:**
- High-frequency oscillations during `walk` and `jog` segments.
- Flat lines during `stay` segments.
- Moderate oscillations during `skip` and `stUp/stDown` segments.
### **Y-Axis (Orange Line)**
- **Trend:**
- Low-amplitude oscillations during `walk` and `jog`.
- Flat lines during `stay` segments.
- Sharp spikes during `stUp` and `stDown` segments.
### **Z-Axis (Green Line)**
- **Trend:**
- Moderate oscillations during `walk` and `jog`.
- Flat lines during `stay` segments.
- Slightly higher amplitude during `skip` and `stUp/stDown` segments.
## 5. **Spatial Grounding and Color Verification**
- **Legend Colors Match Lines:**
- Blue (`x`) aligns with high-frequency oscillations.
- Orange (`y`) aligns with low-amplitude oscillations.
- Green (`z`) aligns with moderate oscillations.
## 6. **Component Isolation**
- **Header:** Contains the title and segment labels.
- **Main Chart:** Line graph with three axes (`x`, `y`, `z`) plotted over time.
- **Footer:** No additional text or markers.
## 7. **Textual Information**
- **Embedded Labels:**
- Segment labels (`walk`, `skip`, `stay`, `jog`, `stUp`, `stDown`) are written in black text above each vertical boundary.
- **Legend Text:**
- `x`, `y`, `z` with corresponding color codes.
## 8. **Conclusion**
The graph visualizes three-dimensional signal data (`x`, `y`, `z`) over time, segmented by discrete actions (`walk`, `skip`, `stay`, `jog`, `stUp`, `stDown`). Each axis exhibits distinct oscillatory patterns tied to specific actions, with `x` showing the highest frequency and `y` the lowest amplitude. No numerical data table is present; trends are inferred visually.