# Technical Data Extraction: Issues Fixed vs. Samples
## 1. Image Overview
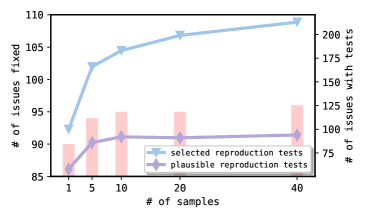
This image is a dual-axis line and bar chart showing the relationship between the number of samples and the number of issues fixed/tested. It contains two line series and one background bar series.
## 2. Axis and Legend Information
### Axis Labels
* **X-axis (Bottom):** `# of samples`
* Markers: `1`, `5`, `10`, `20`, `40`
* **Primary Y-axis (Left):** `# of issues fixed`
* Range: `85` to `110` (increments of 5)
* **Secondary Y-axis (Right):** `# of issues with tests`
* Range: `75` to `200` (increments of 25)
### Legend (Located at bottom right)
* **Light Blue Line with Downward Triangle Markers:** `selected reproduction tests`
* **Purple Line with Diamond Markers:** `plausible reproduction tests`
* **Light Red/Pink Bars (Background):** Unlabeled in legend, but corresponds to the secondary Y-axis (Right).
---
## 3. Data Series Analysis
### Series 1: Selected Reproduction Tests (Light Blue Line)
* **Trend:** Slopes sharply upward from 1 to 5 samples, then continues a steady upward climb with a decreasing rate of growth.
* **Data Points (Approximate):**
* 1 sample: ~92.5
* 5 samples: ~102
* 10 samples: ~104.5
* 20 samples: ~107
* 40 samples: ~109
### Series 2: Plausible Reproduction Tests (Purple Line)
* **Trend:** Slopes upward from 1 to 10 samples, then plateaus, showing almost no growth between 10 and 40 samples.
* **Data Points (Approximate):**
* 1 sample: ~86
* 5 samples: ~90
* 10 samples: ~91
* 20 samples: ~91
* 40 samples: ~91.5
### Series 3: Issues with Tests (Light Red Bars)
* **Trend:** Generally increasing bars corresponding to the right-hand Y-axis.
* **Data Points (Approximate):**
* 1 sample: ~85
* 5 samples: ~110
* 10 samples: ~115
* 20 samples: ~115
* 40 samples: ~125
---
## 4. Summary of Findings
The chart demonstrates that increasing the number of samples significantly improves the number of "selected reproduction tests" (reaching nearly 110 issues fixed). However, the number of "plausible reproduction tests" reaches a point of diminishing returns very quickly, plateauing after 10 samples at approximately 91 issues fixed. The background bars indicate that the total number of issues with tests also grows as samples increase, though at a slower rate than the "selected" line.