## Multi-Panel Figure: Regularization and Head Type Analysis
### Overview
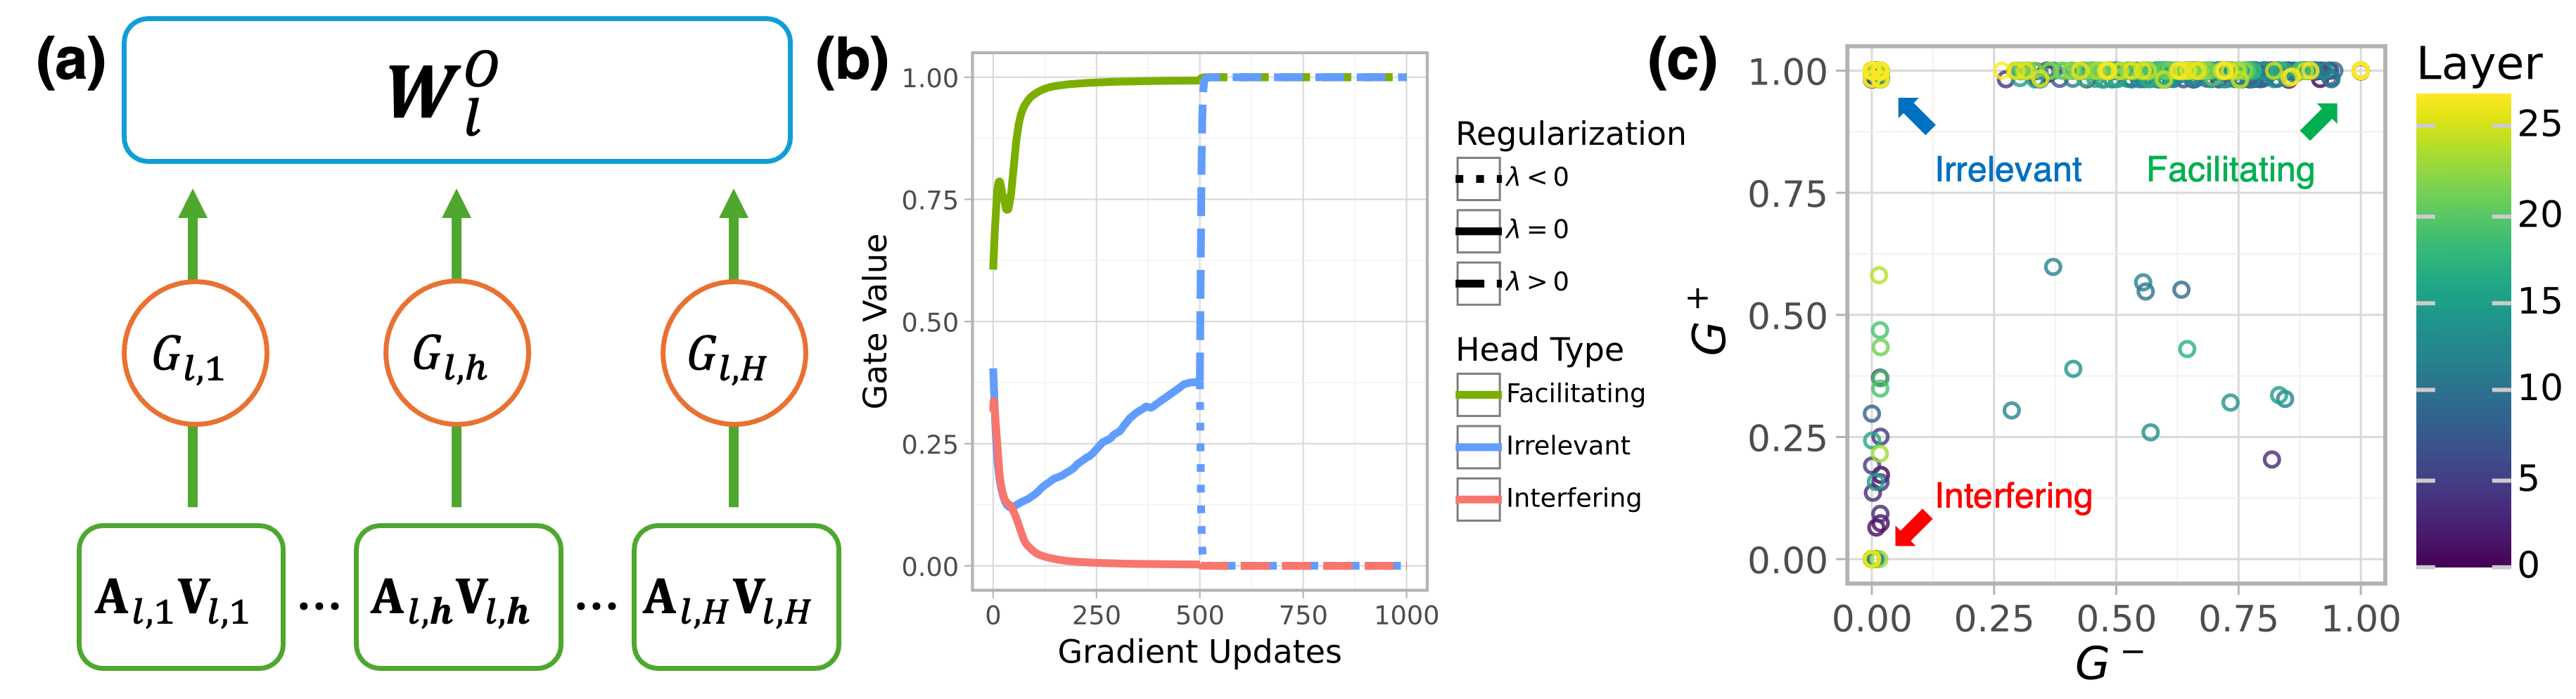
The image presents a multi-panel figure (a, b, c) analyzing the effects of regularization and head type on a model. Panel (a) is a diagram illustrating the model architecture. Panel (b) is a line graph showing the gate value over gradient updates for different head types. Panel (c) is a scatter plot showing the relationship between G+ and G- values, colored by layer.
### Components/Axes
**Panel (a): Model Architecture Diagram**
* **Nodes:**
* Rectangular nodes labeled "A<sub>l,1</sub>V<sub>l,1</sub>", "A<sub>l,h</sub>V<sub>l,h</sub>", ..., "A<sub>l,H</sub>V<sub>l,H</sub>"
* Circular nodes labeled "G<sub>l,1</sub>", "G<sub>l,h</sub>", "G<sub>l,H</sub>"
* A rounded rectangular node at the top labeled "W<sub>l</sub><sup>o</sup>"
* **Connections:** Green arrows indicate the flow of information from the A<sub>l,x</sub>V<sub>l,x</sub> nodes to the G<sub>l,x</sub> nodes, and from the G<sub>l,x</sub> nodes to the W<sub>l</sub><sup>o</sup> node.
**Panel (b): Gate Value vs. Gradient Updates**
* **X-axis:** "Gradient Updates", ranging from 0 to 1000 in increments of 250.
* **Y-axis:** "Gate Value", ranging from 0.00 to 1.00 in increments of 0.25.
* **Legend (Regularization):** Located on the right side of the plot.
* Dashed line: "λ < 0"
* Solid line: "λ = 0"
* Solid line: "λ > 0"
* **Legend (Head Type):** Located below the Regularization legend.
* Green line: "Facilitating"
* Blue line: "Irrelevant"
* Red line: "Interfering"
**Panel (c): G+ vs. G- Scatter Plot**
* **X-axis:** "G-", ranging from 0.00 to 1.00 in increments of 0.25.
* **Y-axis:** "G+", ranging from 0.00 to 1.00 in increments of 0.25.
* **Color Bar (Layer):** Located on the right side of the plot, ranging from 0 (dark purple) to 25 (yellow).
* **Annotations:**
* "Irrelevant" (blue arrow pointing to the top-left cluster)
* "Facilitating" (green arrow pointing to the top-right cluster)
* "Interfering" (red arrow pointing to the bottom-left cluster)
### Detailed Analysis
**Panel (b): Gate Value vs. Gradient Updates**
* **Facilitating (Green):** The gate value starts around 0.75, rapidly increases to approximately 1.00 within the first 250 gradient updates, and remains at 1.00 for the rest of the updates.
* **Irrelevant (Blue):** The gate value starts around 0.35, decreases to approximately 0.15 within the first 250 gradient updates, then gradually increases to approximately 0.35 by 500 gradient updates, and then jumps to 1.00 at 500 gradient updates, remaining at 1.00 for the rest of the updates.
* **Interfering (Red):** The gate value starts around 0.35, rapidly decreases to approximately 0.00 within the first 250 gradient updates, and remains at 0.00 for the rest of the updates.
* **Regularization (Dashed Blue):** The dashed blue line, representing λ < 0, jumps to 1.00 at 500 gradient updates.
**Panel (c): G+ vs. G- Scatter Plot**
* The scatter plot shows the relationship between G+ and G- values, with each point representing a head.
* The color of each point indicates the layer, with darker colors representing lower layers and lighter colors representing higher layers.
* **Irrelevant Heads:** Cluster in the top-left corner (G+ ≈ 1.00, G- ≈ 0.00). These points are mostly yellow, indicating higher layers.
* **Facilitating Heads:** Cluster in the top-right corner (G+ ≈ 1.00, G- ≈ 1.00). These points are mostly yellow, indicating higher layers.
* **Interfering Heads:** Cluster in the bottom-left corner (G+ ≈ 0.00, G- ≈ 0.00). These points are mostly dark purple, indicating lower layers.
* There are some scattered points in the middle of the plot, representing heads with intermediate G+ and G- values.
### Key Observations
* Facilitating heads quickly reach a gate value of 1.00 and maintain it throughout training.
* Interfering heads quickly reach a gate value of 0.00 and maintain it throughout training.
* Irrelevant heads initially have a lower gate value but eventually reach 1.00 after a certain number of gradient updates.
* Irrelevant and Facilitating heads are primarily located in the higher layers, while Interfering heads are primarily located in the lower layers.
### Interpretation
The data suggests that the model learns to quickly identify and prioritize facilitating heads, while suppressing interfering heads. Irrelevant heads are initially less important but become more relevant later in training. The distribution of head types across layers indicates that lower layers tend to focus on interfering heads, while higher layers focus on facilitating and irrelevant heads. The regularization parameter λ < 0 seems to influence the behavior of irrelevant heads, causing them to become active (gate value = 1.00) after a certain number of gradient updates. The G+ and G- values provide a measure of how much a head contributes to the positive and negative gradients, respectively. The clustering of head types in the G+ vs. G- plot indicates that each type has a distinct role in the learning process.