## Diagram: Neural Network Gate Dynamics & Regularization Effects
### Overview
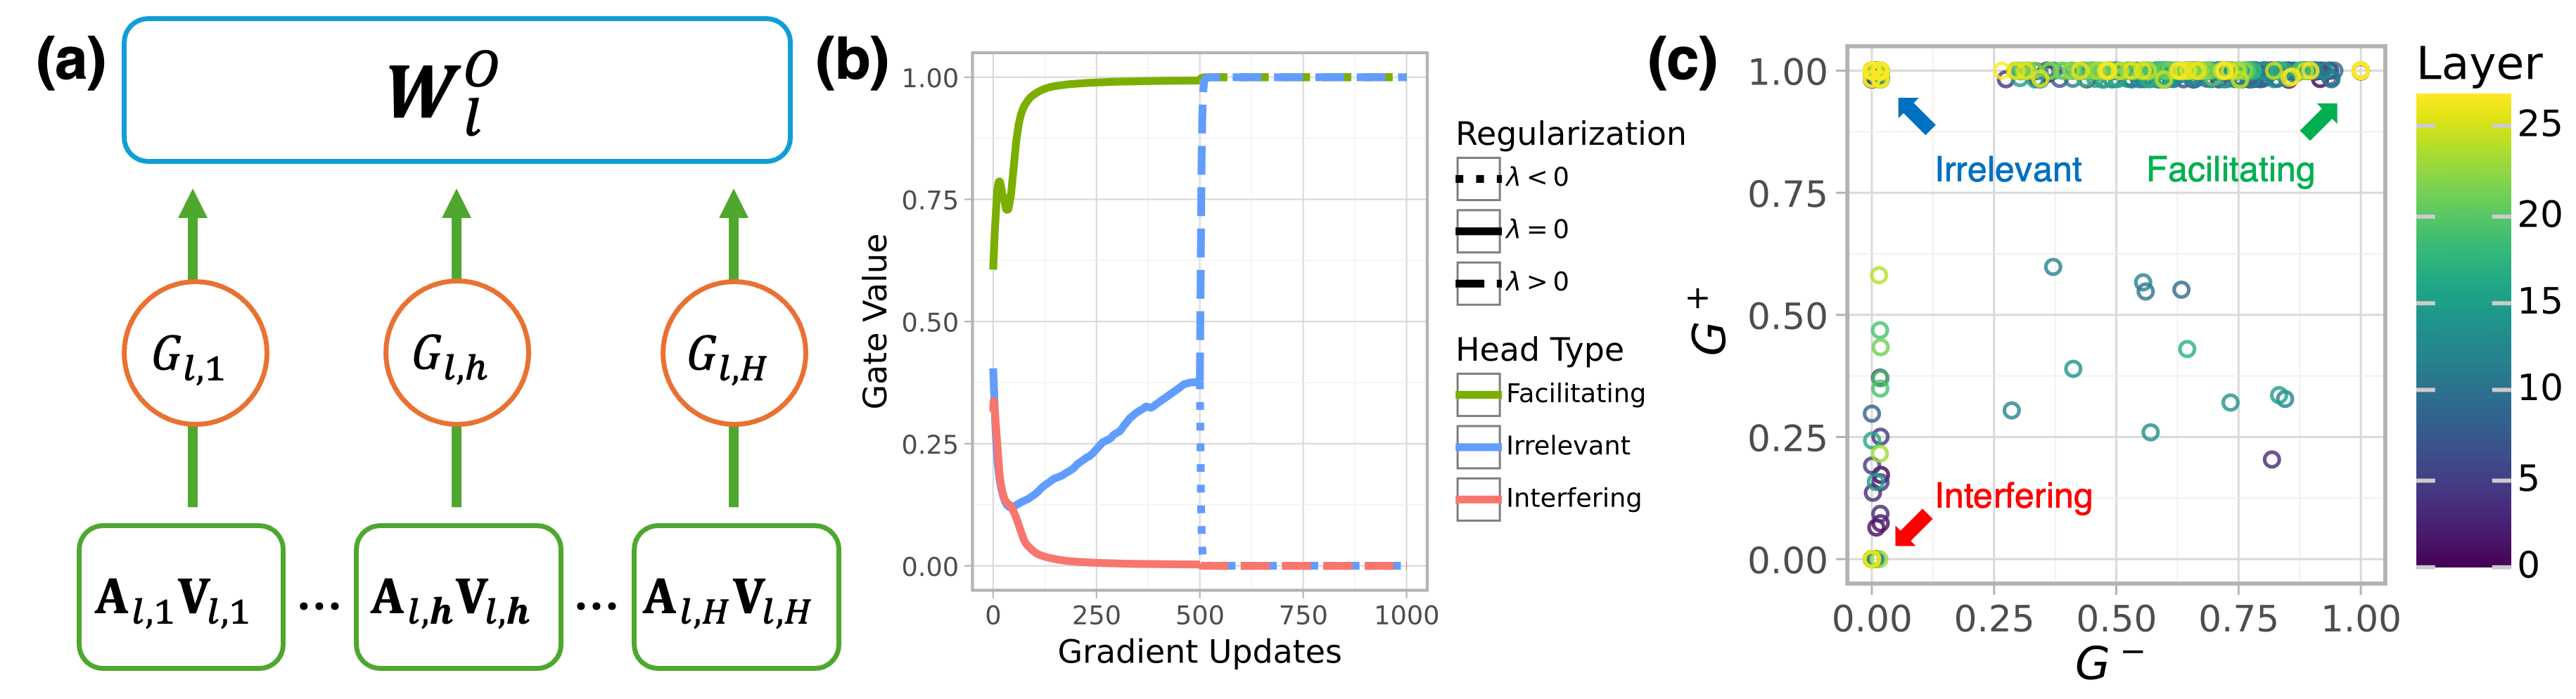
The image presents a composite diagram illustrating aspects of a neural network, specifically focusing on gate dynamics during training and the impact of regularization. It consists of three sub-figures: (a) a schematic of a neural network layer with gate mechanisms, (b) a plot showing gate value changes during gradient updates, and (c) a scatter plot visualizing the relationship between gate values (G-) and layer depth, colored by head type and regularization strength.
### Components/Axes
**(a) Neural Network Layer Schematic:**
* **W<sub>l</sub><sup>0</sup>**: Represents the weight matrix for layer *l*. Located at the top-center.
* **G<sub>l,1</sub>, G<sub>l,h</sub>, G<sub>l,H</sub>**: Gate units for layer *l*. Arranged horizontally.
* **A<sub>l,1</sub>V<sub>l,1</sub>, A<sub>l,h</sub>V<sub>l,h</sub>, A<sub>l,H</sub>V<sub>l,H</sub>**: Input activations for layer *l*. Arranged horizontally below the gate units.
* Arrows indicate the flow of information.
**(b) Gate Value vs. Gradient Updates:**
* **X-axis**: Gradient Updates (0 to 1000, approximately).
* **Y-axis**: Gate Value (0 to 1.00, approximately).
* A single blue line represents the gate value change over gradient updates.
**(c) Gate Value (G-) vs. Layer Depth:**
* **X-axis**: G- (0.00 to 1.00, approximately).
* **Y-axis**: Layer (0.00 to 0.80, approximately).
* **Colorbar**: Represents Layer depth, ranging from 0 to 25.
* **Legend (Top-Right)**:
* **Regularization**:
* λ < 0 (Black Square)
* λ = 0 (Gray Square)
* λ > 0 (Blue Square)
* **Head Type**:
* Facilitating (Green Circle)
* Irrelevant (Orange Circle)
* Interfering (Red Circle)
* Scatter plot points represent data points with color indicating layer depth.
### Detailed Analysis or Content Details
**(a) Neural Network Layer Schematic:**
The diagram shows a layer of a neural network with multiple gate units controlling the flow of information from input activations to the weight matrix. The gate units (G<sub>l,i</sub>) appear to modulate the activations (A<sub>l,i</sub>V<sub>l,i</sub>) before they are processed by the weight matrix (W<sub>l</sub><sup>0</sup>).
**(b) Gate Value vs. Gradient Updates:**
The blue line starts at approximately 0.05 at 0 gradient updates, rapidly increases to around 0.95 by 250 gradient updates, and then plateaus around 0.98 for the remainder of the gradient updates. The curve shows a steep initial increase followed by saturation.
**(c) Gate Value (G-) vs. Layer Depth:**
* **Facilitating (Green)**: Points are scattered across the plot, generally concentrated in the upper-right quadrant (high G-, high layer).
* **Irrelevant (Orange)**: Points are clustered in the lower-left quadrant (low G-, low layer) and some in the middle.
* **Interfering (Red)**: Points are concentrated in the lower-left quadrant (low G-, low layer).
* **Regularization λ < 0 (Black)**: A few points are scattered.
* **Regularization λ = 0 (Gray)**: A moderate number of points are scattered.
* **Regularization λ > 0 (Blue)**: The majority of points are scattered.
* The color gradient indicates that points in the upper-right tend to have higher layer values (darker purple/blue).
### Key Observations
* Gate values in (b) quickly saturate during training.
* In (c), Facilitating heads tend to have higher G- values and are found in deeper layers.
* Interfering heads are generally associated with lower G- values and shallower layers.
* The regularization parameter (λ) appears to influence the distribution of points, with λ > 0 having the most points.
* The colorbar in (c) shows a clear correlation between G- and layer depth.
### Interpretation
The diagrams collectively suggest a mechanism for understanding how gate units in a neural network evolve during training and how regularization affects their behavior. The rapid saturation of gate values (b) indicates that gates quickly learn to either allow or block information flow. The scatter plot (c) reveals that different head types (Facilitating, Irrelevant, Interfering) exhibit distinct patterns in terms of their gate values and layer depth. Facilitating heads, which presumably contribute positively to the network's performance, are more prevalent in deeper layers and have higher gate values. Interfering heads, conversely, are found in shallower layers and have lower gate values. The influence of regularization (λ) suggests that it can modulate the distribution of these head types, potentially promoting the development of more beneficial gate configurations. The color gradient in (c) further reinforces the idea that gate values are correlated with layer depth, implying that deeper layers may require more selective gating mechanisms. The diagram provides a visual representation of the interplay between gate dynamics, head type, regularization, and layer depth in a neural network, offering insights into the network's learning process and the role of different components.