## Diagram: Neural Network Layer Analysis with Training Dynamics
### Overview
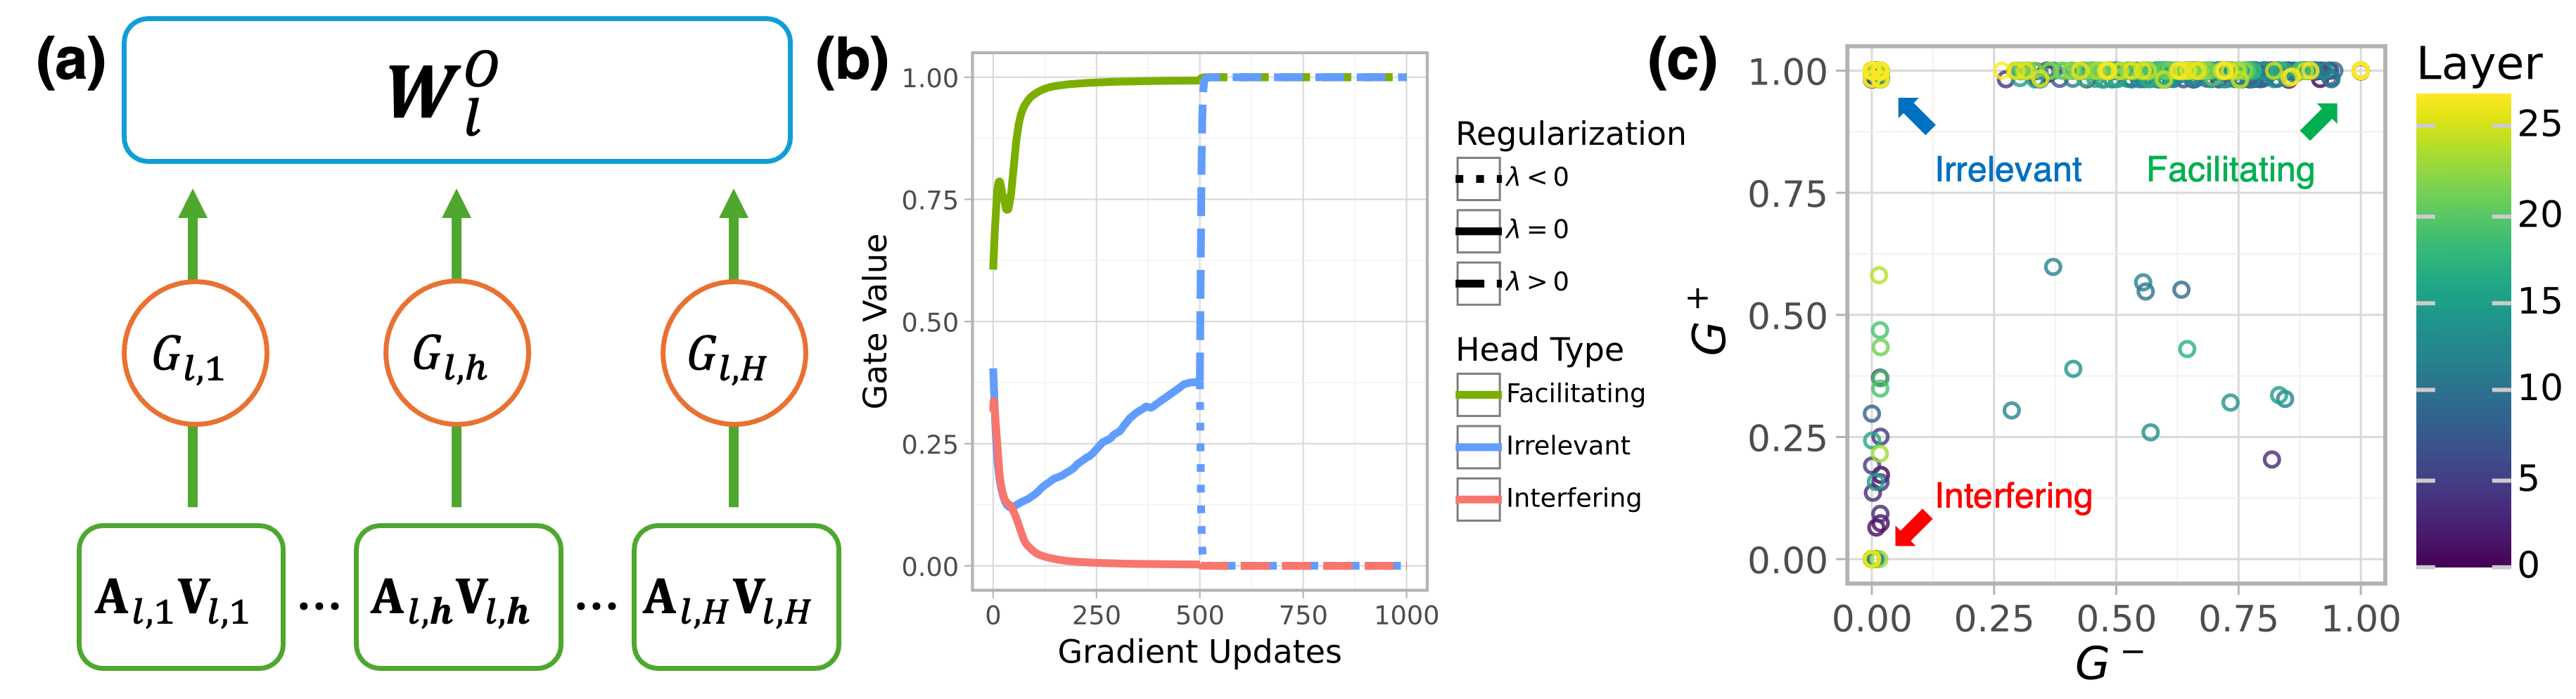
The image presents a three-part technical visualization analyzing neural network layer dynamics. Part (a) shows a schematic of a layer's weight matrix and gate interactions, part (b) displays training dynamics of different head types, and part (c) illustrates the relationship between two gate metrics across layers.
### Components/Axes
**(a) Neural Network Layer Diagram**
- **Top Block**: Weight matrix $ W_l^O $ (blue rectangle)
- **Middle Layer**: Three orange circles labeled:
- $ G_{l,1} $ (left)
- $ G_{l,h} $ (middle)
- $ G_{l,H} $ (right)
- **Bottom Layer**: Green rectangles with $ A_{l,i}V_{l,i} $ (i=1 to H)
- **Arrows**: Vertical connections between weight matrix → gates → activations
**(b) Training Dynamics Graph**
- **X-axis**: Gradient Updates (0-1000)
- **Y-axis**: Gate Value (0.00-1.00)
- **Lines**:
- Green (Facilitating): Starts at ~0.75, plateaus at 1.00
- Blue (Irrelevant): Starts at 0.00, rises to ~0.50, plateaus
- Red (Interfering): Starts at ~0.75, drops to ~0.25, plateaus
- **Legend**:
- Dotted black: $ \lambda < 0 $
- Solid black: $ \lambda = 0 $
- Dashed black: $ \lambda > 0 $
**(c) Gate Metric Scatter Plot**
- **X-axis**: $ G^- $ (0.00-1.00)
- **Y-axis**: $ G^+ $ (0.00-1.00)
- **Color Coding**:
- Green: Facilitating
- Blue: Irrelevant
- Red: Interfering
- **Layer Scale**: 0-25 (purple to yellow gradient)
- **Legend**:
- Yellow circles: Layer 25
- Purple circles: Layer 0
### Detailed Analysis
**(a) Component Flow**
- Weight matrix $ W_l^O $ distributes information to three gate types
- Gates $ G_{l,1} $ (input), $ G_{l,h} $ (hidden), $ G_{l,H} $ (output) modulate activations
- Activations $ A_{l,i}V_{l,i} $ represent processed information flow
**(b) Training Dynamics**
- **Facilitating Heads** (green):
- Rapid convergence to maximum gate value (1.00)
- Stabilizes by ~250 updates
- **Irrelevant Heads** (blue):
- Gradual increase to 0.50 gate value
- Plateaus after ~500 updates
- **Interfering Heads** (red):
- Initial high gate value (~0.75)
- Sharp decline to 0.25 by ~250 updates
**(c) Gate Metric Relationships**
- **Facilitating Heads** (green):
- Clustered at high $ G^+ $ (0.75-1.00) and moderate $ G^- $ (0.25-0.75)
- Layer 25 (yellow) shows highest $ G^+ $
- **Irrelevant Heads** (blue):
- Distributed across mid-range $ G^+ $ (0.25-0.50) and $ G^- $ (0.25-0.75)
- **Interfering Heads** (red):
- Located at low $ G^+ $ (0.00-0.25) and low $ G^- $ (0.00-0.25)
### Key Observations
1. **Training Stability**: Facilitating heads stabilize earliest (250 updates), while irrelevant heads take longest (500+ updates)
2. **Gate Value Correlation**: Higher $ G^+ $ values correlate with better performance (Facilitating heads)
3. **Layer Depth**: Deeper layers (yellow) show more extreme $ G^+ $ values
4. **Interfering Head Pattern**: Consistent low performance across all layers
### Interpretation
The visualization demonstrates how different attention head types behave during training:
- **Facilitating Heads** (green) show optimal training dynamics, quickly reaching maximum gate values and maintaining stability
- **Irrelevant Heads** (blue) represent underperforming components that gradually improve but never reach optimal performance
- **Interfering Heads** (red) demonstrate detrimental behavior, starting strong but rapidly degrading
The scatter plot in (c) reveals that effective heads (Facilitating) occupy the upper-right quadrant of the $ G^+ $-$ G^- $ space, suggesting a positive correlation between these metrics and model performance. The layer depth gradient indicates that deeper layers tend to develop more extreme gate values, potentially reflecting increased representational power or overfitting risks.
The training dynamics in (b) highlight the importance of regularization ($ \lambda $) in controlling head behavior, with different $ \lambda $ values affecting convergence patterns. This analysis provides critical insights for optimizing neural network architectures by identifying and managing different head types during training.