## Heatmap: AUROC for Projections a^Tt
### Overview
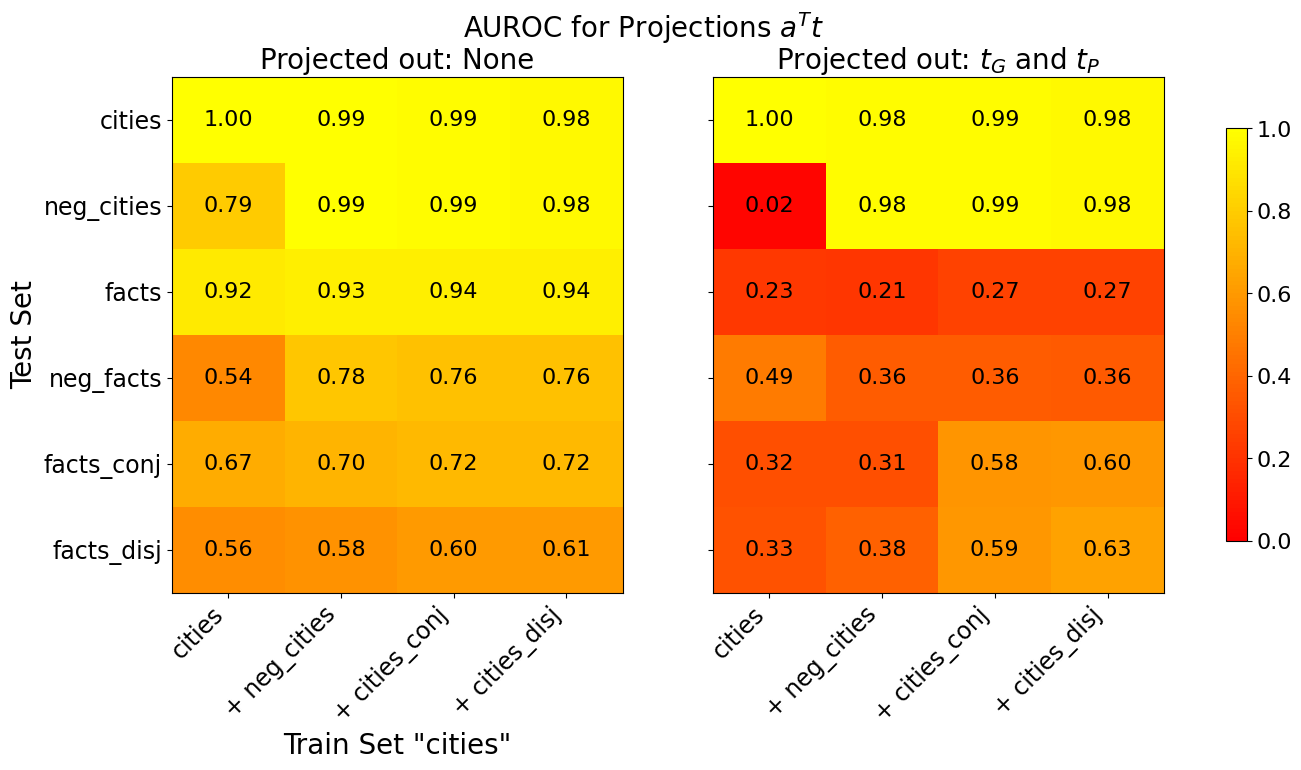
The image presents two heatmaps comparing the Area Under the Receiver Operating Characteristic Curve (AUROC) for different projections. The left heatmap shows results when no projections are removed ("Projected out: None"), while the right heatmap shows results when projections tG and tP are removed ("Projected out: tG and tP"). The heatmaps compare performance across different test sets (cities, neg_cities, facts, neg_facts, facts_conj, facts_disj) and train sets (cities, + neg_cities, + cities_conj, + cities_disj). The color intensity represents the AUROC score, ranging from red (low AUROC) to yellow (high AUROC), as indicated by the colorbar on the right.
### Components/Axes
* **Title:** AUROC for Projections a^Tt
* **X-axis (Train Set "cities"):** cities, + neg\_cities, + cities\_conj, + cities\_disj
* **Y-axis (Test Set):** cities, neg\_cities, facts, neg\_facts, facts\_conj, facts\_disj
* **Heatmap 1 Title:** Projected out: None
* **Heatmap 2 Title:** Projected out: tG and tP
* **Colorbar:** Ranges from 0.0 (red) to 1.0 (yellow), with increments of 0.2.
### Detailed Analysis
**Heatmap 1: Projected out: None**
| Test Set | cities | + neg\_cities | + cities\_conj | + cities\_disj |
| :---------- | :----- | :------------ | :------------- | :------------- |
| cities | 1.00 | 0.99 | 0.99 | 0.98 |
| neg\_cities | 0.79 | 0.99 | 0.99 | 0.98 |
| facts | 0.92 | 0.93 | 0.94 | 0.94 |
| neg\_facts | 0.54 | 0.78 | 0.76 | 0.76 |
| facts\_conj | 0.67 | 0.70 | 0.72 | 0.72 |
| facts\_disj | 0.56 | 0.58 | 0.60 | 0.61 |
* **cities:** Consistently high AUROC scores (0.98-1.00) across all train sets.
* **neg\_cities:** High AUROC scores (0.98-0.99) except when trained on "cities" alone (0.79).
* **facts:** High AUROC scores (0.92-0.94) across all train sets.
* **neg\_facts:** Lower AUROC scores (0.54-0.78) compared to other test sets.
* **facts\_conj:** Moderate AUROC scores (0.67-0.72).
* **facts\_disj:** Moderate AUROC scores (0.56-0.61).
**Heatmap 2: Projected out: tG and tP**
| Test Set | cities | + neg\_cities | + cities\_conj | + cities\_disj |
| :---------- | :----- | :------------ | :------------- | :------------- |
| cities | 1.00 | 0.98 | 0.99 | 0.98 |
| neg\_cities | 0.02 | 0.98 | 0.99 | 0.98 |
| facts | 0.23 | 0.21 | 0.27 | 0.27 |
| neg\_facts | 0.49 | 0.36 | 0.36 | 0.36 |
| facts\_conj | 0.32 | 0.31 | 0.58 | 0.60 |
| facts\_disj | 0.33 | 0.38 | 0.59 | 0.63 |
* **cities:** Consistently high AUROC scores (0.98-1.00) across all train sets.
* **neg\_cities:** Very low AUROC score when trained on "cities" alone (0.02), but high scores (0.98-0.99) when trained on other sets.
* **facts:** Low AUROC scores (0.21-0.27) across all train sets.
* **neg\_facts:** Low AUROC scores (0.36-0.49).
* **facts\_conj:** Low AUROC scores (0.31-0.32) when trained on "cities" and "+ neg\_cities", but higher scores (0.58-0.60) when trained on other sets.
* **facts\_disj:** Low AUROC scores (0.33-0.38) when trained on "cities" and "+ neg\_cities", but higher scores (0.59-0.63) when trained on other sets.
### Key Observations
* Removing projections tG and tP significantly impacts the AUROC scores for most test sets, except for "cities".
* The "neg\_cities" test set shows a drastic drop in performance when trained only on "cities" after removing the projections.
* The "facts", "neg\_facts", "facts\_conj", and "facts\_disj" test sets generally have lower AUROC scores when projections tG and tP are removed.
### Interpretation
The heatmaps demonstrate the impact of removing specific projections (tG and tP) on the performance of a model trained and tested on different datasets. The significant drop in AUROC scores for most test sets when these projections are removed suggests that tG and tP contain important information for generalizing to these datasets. The "cities" test set appears to be less sensitive to the removal of these projections, indicating that it may rely on different features or have a simpler underlying structure. The drastic drop in performance for "neg_cities" when trained only on "cities" after removing the projections suggests that the relationship between these two datasets is heavily dependent on the information contained in tG and tP. The results highlight the importance of feature selection and the potential impact of removing relevant information on model performance.