## Heatmap: AUROC for Projections Aᵀt
### Overview
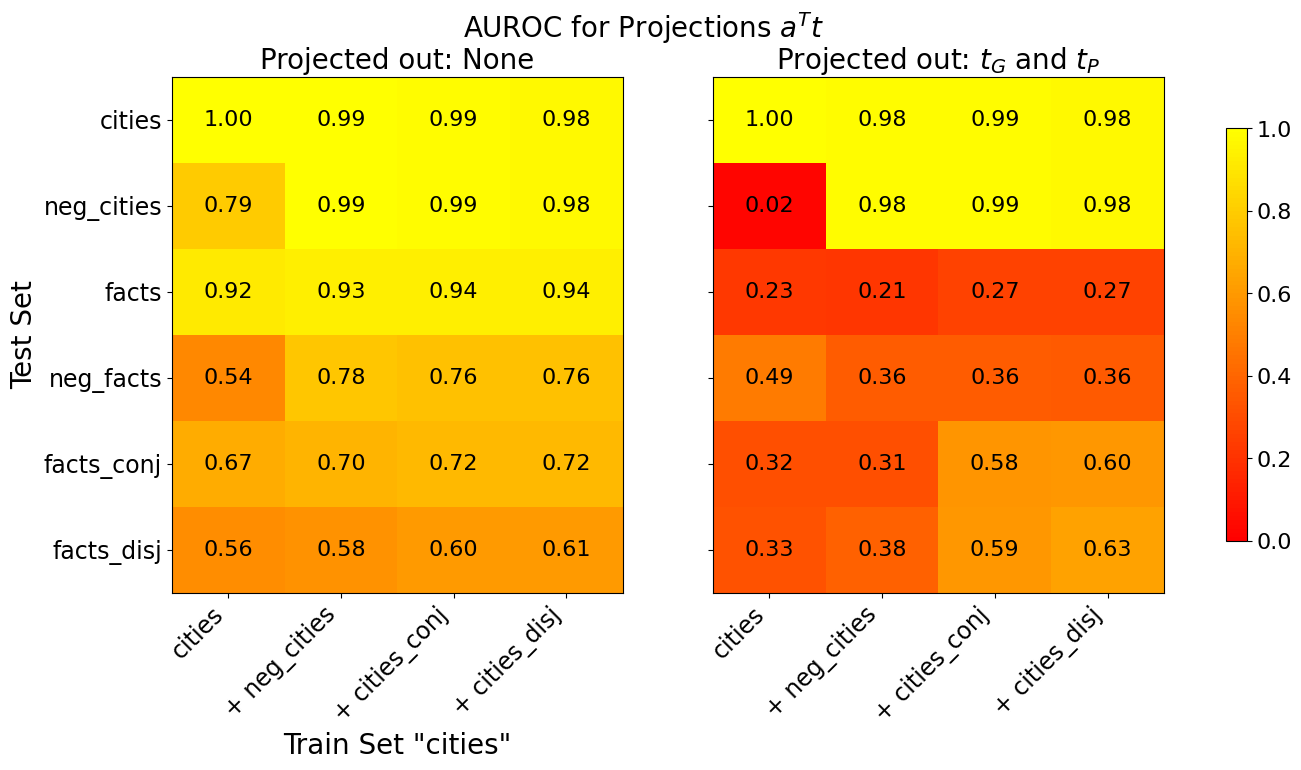
This image presents two heatmaps comparing Area Under the Receiver Operating Characteristic curve (AUROC) scores for different training and testing sets. The heatmaps visualize the performance of projections, with the left heatmap showing results when no projections are applied ("Projected out: None") and the right heatmap showing results when projections *t<sub>G</sub>* and *t<sub>P</sub>* are applied ("Projected out: t<sub>G</sub> and t<sub>P</sub>"). Both heatmaps use the same training and testing set categories.
### Components/Axes
* **Title:** "AUROC for Projections Aᵀt" (centered at the top)
* **Subtitles:** "Projected out: None" (top-left) and "Projected out: t<sub>G</sub> and t<sub>P</sub>" (top-right)
* **X-axis Label:** "Train Set 'cities'" (bottom-center)
* **Y-axis Label:** "Test Set" (left-center)
* **X-axis Categories:** "cities", "+ neg\_cities", "+ cities\_conj", "+ cities\_disj"
* **Y-axis Categories:** "cities", "neg\_cities", "facts", "neg\_facts", "facts\_conj", "facts\_disj"
* **Color Scale/Legend:** A vertical color bar on the right side, ranging from dark red (approximately 0.0) to yellow (approximately 1.0). The scale indicates AUROC scores.
### Detailed Analysis
**Left Heatmap ("Projected out: None")**
The left heatmap shows generally high AUROC scores. The color intensity decreases as you move down and to the right, indicating lower performance.
* **cities vs. cities:** 1.00
* **cities vs. + neg\_cities:** 0.79
* **cities vs. + cities\_conj:** 0.92
* **cities vs. + cities\_disj:** 0.54
* **+ neg\_cities vs. cities:** 0.99
* **+ neg\_cities vs. + neg\_cities:** 0.99
* **+ neg\_cities vs. + cities\_conj:** 0.78
* **+ neg\_cities vs. + cities\_disj:** 0.54
* **+ cities\_conj vs. cities:** 0.99
* **+ cities\_conj vs. + neg\_cities:** 0.99
* **+ cities\_conj vs. + cities\_conj:** 0.94
* **+ cities\_conj vs. + cities\_disj:** 0.70
* **+ cities\_disj vs. cities:** 0.98
* **+ cities\_disj vs. + neg\_cities:** 0.98
* **+ cities\_disj vs. + cities\_conj:** 0.76
* **+ cities\_disj vs. + cities\_disj:** 0.61
**Right Heatmap ("Projected out: t<sub>G</sub> and t<sub>P</sub>")**
The right heatmap shows a more varied range of AUROC scores, with some significant drops in performance compared to the left heatmap.
* **cities vs. cities:** 1.00
* **cities vs. + neg\_cities:** 0.02
* **cities vs. + cities\_conj:** 0.23
* **cities vs. + cities\_disj:** 0.33
* **+ neg\_cities vs. cities:** 0.98
* **+ neg\_cities vs. + neg\_cities:** 0.98
* **+ neg\_cities vs. + cities\_conj:** 0.36
* **+ neg\_cities vs. + cities\_disj:** 0.38
* **+ cities\_conj vs. cities:** 0.99
* **+ cities\_conj vs. + neg\_cities:** 0.99
* **+ cities\_conj vs. + cities\_conj:** 0.27
* **+ cities\_conj vs. + cities\_disj:** 0.31
* **+ cities\_disj vs. cities:** 0.98
* **+ cities\_disj vs. + neg\_cities:** 0.98
* **+ cities\_disj vs. + cities\_conj:** 0.58
* **+ cities\_disj vs. + cities\_disj:** 0.63
### Key Observations
* The application of projections *t<sub>G</sub>* and *t<sub>P</sub>* significantly reduces the AUROC scores for many combinations, particularly when comparing "cities" to the other test sets.
* The highest scores are consistently achieved when the training and testing sets are identical (diagonal of both heatmaps).
* The "cities" category consistently performs well as a training set, regardless of the test set, in the "Projected out: None" heatmap.
* The "neg\_cities" category performs well as a test set, regardless of the training set, in the "Projected out: None" heatmap.
* The "facts" and "facts\_conj" categories show moderate performance in the "Projected out: None" heatmap.
* The "facts\_disj" category consistently shows the lowest performance in the "Projected out: None" heatmap.
### Interpretation
The data suggests that the projections *t<sub>G</sub>* and *t<sub>P</sub>* are detrimental to the performance of the model, especially when trying to generalize from the "cities" training set to other categories. The substantial drop in AUROC scores indicates that these projections introduce noise or distort the feature space, making it harder to discriminate between the different test sets.
The high performance when training and testing on the same category (diagonal) indicates that the model can effectively learn to identify instances within a specific category. However, the performance drops significantly when tested on different categories, suggesting limited generalization ability.
The difference between the two heatmaps highlights the importance of feature selection or dimensionality reduction techniques. The "Projected out: None" heatmap suggests that the original feature space is relatively well-suited for the task, while the "Projected out: t<sub>G</sub> and t<sub>P</sub>" heatmap indicates that these specific projections degrade the quality of the feature representation.
The consistent lower performance of "facts\_disj" suggests that this category is inherently more difficult to classify, potentially due to its complexity or ambiguity. Further investigation into the characteristics of this category may be warranted.