## Heatmap: AUROC for Projections a^Tt
### Overview
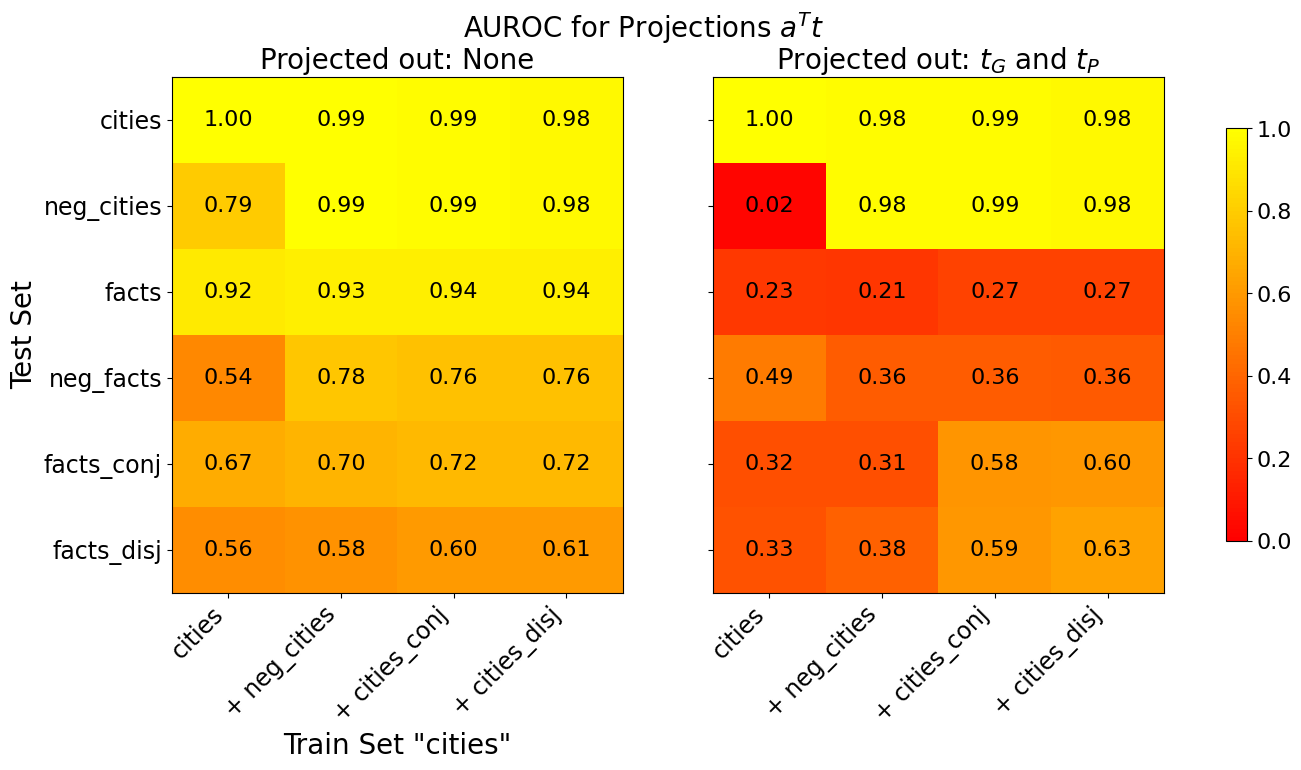
The image presents two side-by-side heatmaps comparing Area Under the Receiver Operating Characteristic (AUROC) values for different combinations of training and test sets under two projection scenarios: (1) no projections applied, and (2) projections of `t_G` and `t_P` applied. The heatmaps use a color gradient from red (low AUROC) to yellow (high AUROC), with numerical values explicitly labeled in each cell.
---
### Components/Axes
- **X-axis (Train Set "cities")**:
Subcategories:
- `cities`
- `+ neg_cities`
- `+ cities_conj`
- `+ cities_disj`
- **Y-axis (Test Set)**:
Subcategories:
- `cities`
- `neg_cities`
- `facts`
- `neg_facts`
- `facts_conj`
- `facts_disj`
- **Legend**:
A color bar on the right maps AUROC values from 0.0 (red) to 1.0 (yellow).
- **Key Titles**:
- Main title: "AUROC for Projections a^Tt"
- Subtitles:
- Left heatmap: "Projected out: None"
- Right heatmap: "Projected out: t_G and t_P"
---
### Detailed Analysis
#### Left Heatmap (Projected out: None)
- **Trend**: AUROC values are generally high (≥0.76) across most combinations, with the highest values (1.00–0.99) along the diagonal where train and test sets match.
- **Notable Values**:
- `cities` vs. `cities`: 1.00
- `neg_cities` vs. `cities`: 0.79
- `facts` vs. `cities`: 0.92
- `facts_disj` vs. `cities`: 0.56
#### Right Heatmap (Projected out: t_G and t_P)
- **Trend**: AUROC values drop significantly compared to the left heatmap, with many cells in red/orange (≤0.63). The diagonal still shows high values (0.98–1.00), but cross-category performance degrades sharply.
- **Notable Values**:
- `cities` vs. `neg_cities`: 0.02 (lowest value)
- `facts` vs. `cities`: 0.23
- `facts_disj` vs. `cities`: 0.33
- `cities_disj` vs. `cities_disj`: 0.63
---
### Key Observations
1. **Diagonal Dominance**: Both heatmaps show high AUROC values (0.98–1.00) along the diagonal, indicating strong performance when train and test sets match.
2. **Projection Impact**: Projecting out `t_G` and `t_P` reduces AUROC values by 30–50% for cross-category comparisons (e.g., `neg_cities` vs. `cities` drops from 0.79 to 0.02).
3. **Category Sensitivity**:
- `facts` and `neg_facts` show moderate performance in the left heatmap but collapse under projection (e.g., `facts` vs. `cities` drops from 0.92 to 0.23).
- `facts_conj` and `facts_disj` exhibit the most severe degradation when projections are applied.
---
### Interpretation
The data demonstrates that projecting out `t_G` and `t_P` severely limits the model's ability to generalize across different categories. While the unprojected scenario maintains high AUROC values even for dissimilar categories (e.g., `facts` vs. `cities` at 0.92), the projected scenario collapses performance for these cases (0.23). This suggests that `t_G` and `t_P` contain critical information for distinguishing between categories, and their removal disrupts the model's discriminative power. The diagonal dominance in both heatmaps highlights the importance of matching train-test distributions for optimal performance.
**Notable Anomaly**: The extreme drop in AUROC for `neg_cities` vs. `cities` under projection (0.02) indicates a near-total failure to distinguish these categories when `t_G` and `t_P` are removed, possibly due to overlapping features in the projected space.