\n
## Diagram: Dot Distribution Patterns
### Overview
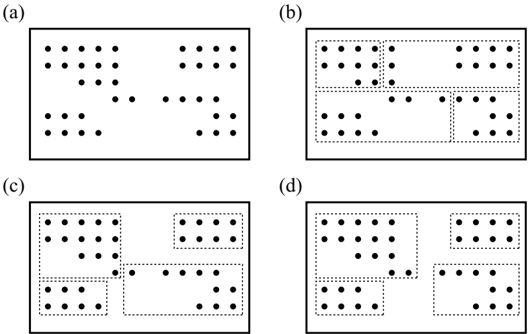
The image presents four distinct arrangements of dots within rectangular frames, labeled (a) through (d). Each frame contains a collection of black dots, and some frames also include dotted-line rectangles partitioning the space. The purpose appears to be illustrating different spatial distributions or groupings of points. There are no axes, legends, or numerical values provided.
### Components/Axes
The image consists of four rectangular frames, each labeled with a letter: (a), (b), (c), and (d). Each frame contains a varying number of black dots. Frames (b), (c), and (d) also contain dotted-line rectangles that divide the space into smaller regions. There are no axis labels or legends.
### Detailed Analysis or Content Details
* **Frame (a):** Approximately 30-35 dots are scattered across the frame. The dots are not organized into distinct clusters, but appear relatively evenly distributed, with a slightly higher density in the top-left corner.
* **Frame (b):** Approximately 25-30 dots are present. The frame is divided into four regions by dotted lines. The top-right region contains approximately 8-10 dots. The top-left region contains approximately 4-6 dots. The bottom-left region contains approximately 6-8 dots. The bottom-right region contains approximately 6-8 dots.
* **Frame (c):** Approximately 30-35 dots are present. The frame is divided into three regions by dotted lines. The top-left region contains approximately 10-12 dots. The top-right region contains approximately 6-8 dots. The bottom region contains approximately 12-14 dots.
* **Frame (d):** Approximately 25-30 dots are present. The frame is divided into three regions by dotted lines. The top-left region contains approximately 8-10 dots. The top-right region contains approximately 6-8 dots. The bottom region contains approximately 10-12 dots.
### Key Observations
The primary difference between the frames lies in the organization of the dots. Frame (a) shows a random or uniform distribution, while frames (b), (c), and (d) demonstrate a partitioned distribution, where dots are grouped within defined regions. The number of dots in each region varies across frames (b), (c), and (d).
### Interpretation
The image likely illustrates different spatial patterns or distributions of data points. Frame (a) could represent a control condition or a baseline distribution. Frames (b), (c), and (d) could represent different experimental conditions where the points are constrained or grouped into specific areas. The dotted lines suggest boundaries or categories. The varying number of dots within each region in frames (b), (c), and (d) could indicate different levels of concentration or preference for those regions. Without further context, it's difficult to determine the specific meaning of these patterns, but they could represent anything from population density to experimental results. The image is a visual representation of spatial data, but lacks quantitative data to support a more detailed analysis.