## Diagram: Dot Clustering and Grouping Variations
### Overview
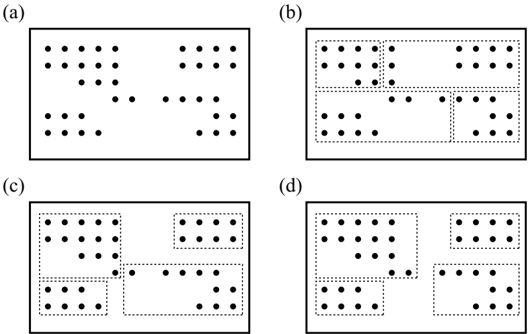
The image displays four rectangular panels, labeled (a) through (d), each containing an identical arrangement of black dots. The panels demonstrate different ways to group or segment these dots using dotted-line rectangles. The underlying dot pattern is constant across all panels, but the proposed groupings (represented by the dotted boundaries) vary, illustrating different interpretations of spatial clustering or data segmentation.
### Components/Axes
* **Panels:** Four distinct panels arranged in a 2x2 grid.
* Top-left: Panel (a)
* Top-right: Panel (b)
* Bottom-left: Panel (c)
* Bottom-right: Panel (d)
* **Primary Elements:** Black dots of uniform size.
* **Grouping Elements:** Dotted-line rectangles (present in panels b, c, and d).
* **Labels:** Each panel is labeled with a lowercase letter in parentheses: `(a)`, `(b)`, `(c)`, `(d)`. These labels are positioned at the top-left corner outside each panel's border.
* **Axes:** None. This is a conceptual diagram, not a quantitative chart.
### Detailed Analysis
The core data (the dot arrangement) is identical in all four panels. The variation is in the applied grouping logic.
**Common Dot Pattern (All Panels):**
The dots form four primary clusters within the rectangular frame:
1. **Top-Left Cluster:** A dense, roughly rectangular group of dots.
2. **Top-Right Cluster:** A smaller, rectangular group.
3. **Bottom-Left Cluster:** A smaller, rectangular group.
4. **Bottom-Center/Right Cluster:** A more elongated, irregular group.
**Panel-Specific Grouping (Dotted Rectangles):**
* **Panel (a):** No grouping rectangles are present. Only the raw dot pattern is shown.
* **Panel (b):** Three dotted rectangles are used.
* **Top-Left Rectangle:** Encloses the top-left cluster but is split internally by a vertical dotted line, creating two subgroups within the same main cluster.
* **Top-Right Rectangle:** Encloses the top-right cluster.
* **Bottom Rectangle:** A single, wide rectangle that encloses both the bottom-left and bottom-center/right clusters together.
* **Panel (c):** Four dotted rectangles are used, each isolating one of the four primary clusters.
* **Top-Left Rectangle:** Encloses the top-left cluster.
* **Top-Right Rectangle:** Encloses the top-right cluster.
* **Bottom-Left Rectangle:** Encloses the bottom-left cluster.
* **Bottom-Right Rectangle:** Encloses the bottom-center/right cluster.
* **Panel (d):** Three dotted rectangles are used, with a different logic than panel (b).
* **Top-Left Rectangle:** Encloses the top-left cluster and is split internally by a vertical dotted line, creating two subgroups (similar to panel b).
* **Top-Right Rectangle:** Encloses the top-right cluster.
* **Bottom-Right Rectangle:** Encloses only the bottom-center/right cluster.
* **Note:** The bottom-left cluster is **not** enclosed by any dotted rectangle in this panel.
### Key Observations
1. **Identical Underlying Data:** The spatial distribution of dots is a constant control variable across all four examples.
2. **Grouping Subjectivity:** The diagrams visually argue that the same dataset can be meaningfully segmented in multiple, conflicting ways.
3. **Hierarchy and Division:** Panels (b) and (d) introduce the concept of subdividing a single dense cluster (top-left) into two subgroups, suggesting a hierarchical or finer-grained analysis.
4. **Inclusion vs. Exclusion:** Panel (d) is notable for leaving one cluster (bottom-left) completely ungrouped, which could represent an outlier, noise, or a cluster that doesn't meet a specific grouping criterion.
5. **Granularity Contrast:** Panel (c) represents the most granular grouping (one box per natural cluster), while panel (b) represents a coarser grouping (merging two bottom clusters).
### Interpretation
This diagram is a classic illustration of the **cluster analysis** or **segmentation problem** in fields like data science, pattern recognition, computer vision, and geography. It demonstrates that "grouping" is not an intrinsic property of the data but an interpretive act dependent on the chosen algorithm, parameters, or human perspective.
* **What it suggests:** There is no single "correct" way to partition this set of points. The choice involves trade-offs:
* **Panel (c)** prioritizes **purity** and separation of distinct visual masses.
* **Panel (b)** suggests a **hierarchical** view (main clusters and sub-clusters) and may prioritize **continuity** by merging the two bottom clusters.
* **Panel (d)** might represent an algorithm with a **minimum cluster size** or **density threshold**, causing the smaller bottom-left cluster to be excluded or classified as noise.
* **Why it matters:** This concept is foundational for understanding how machines and humans find patterns. It warns against assuming a single "true" structure in unsupervised learning tasks. The diagram could be used to explain concepts like:
* The difference between **flat** (c) and **hierarchical** (b, d) clustering.
* The impact of **distance metrics** and **linkage criteria** in algorithms like K-means or DBSCAN.
* The subjectivity involved in defining **regions of interest** in image processing or **sales territories** in business analytics.
**Language Declaration:** The only text present is the English labels `(a)`, `(b)`, `(c)`, `(d)`. No other language is present in the image.